- Freight indices provide standardized benchmarks that help track changes in global shipping conditions across containerized and bulk cargo markets
- By reflecting spot market movements and underlying supply–demand dynamics, freight indices support logistics planning, contract discussions, and market monitoring across global trade flows

Global trade depends on the continuous movement of goods across complex shipping networks. As cargo flows through multiple trade lanes, vessel types, and transport stages, freight rates fluctuate in response to changes in demand, capacity, and operating conditions. To navigate this complexity, market participants rely on freight indices as standardized reference points that track shipping cost movements over time.
Rather than focusing on individual transactions, freight indices aggregate large volumes of rate data to provide a broader view of market conditions. These indices are widely used across global logistics, trading, and procurement activities to monitor trends, compare routes, and support informed decision-making in volatile shipping environments.
As global supply chains grow more interconnected, understanding how freight indices are structured and what they reflect has become an essential part of reading market signals across trade and commodity flows.
What Freight Indices Represent in Global Trade
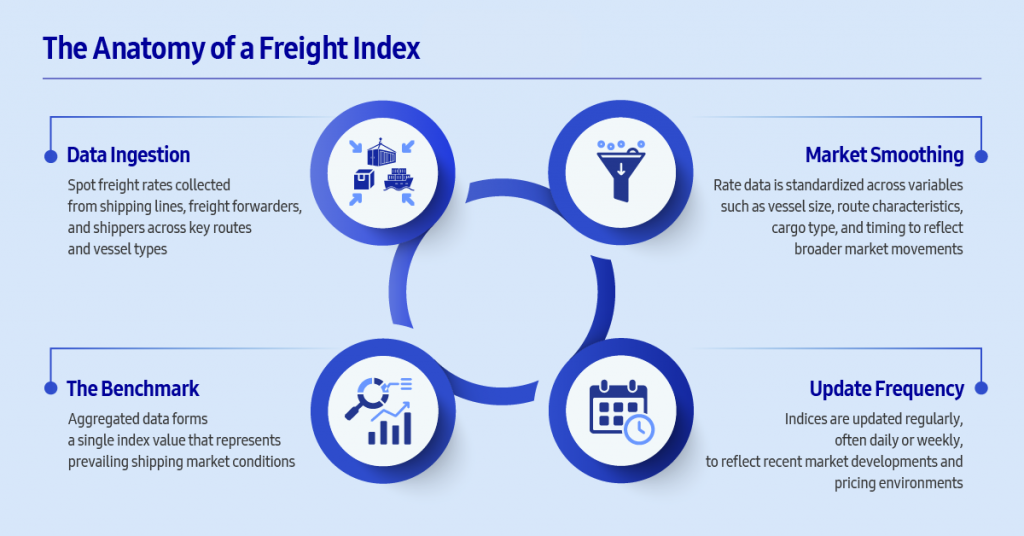
Freight indices are benchmarks designed to track changes in shipping costs across selected routes, vessel classes, or cargo types. They are typically constructed using spot market freight rates collected from multiple market participants, including shipping lines, freight forwarders, and shippers. By aggregating this data, indices aim to reflect overall market conditions rather than the specifics of individual contracts or cargo movements.
In shipping markets, transactions are inherently heterogeneous. Freight rates can vary depending on vessel size, route characteristics, cargo type, timing, and contractual terms. Freight indices address this complexity by smoothing out these differences and isolating broader market movements. Academic research on freight index construction shows that a significant share of freight rate variation reflects time-driven market conditions rather than vessel- or contract-specific factors, reinforcing the value of indices as indicators of underlying market trends.
Most widely used freight indices are updated on a regular basis, often weekly or daily, allowing users to track how shipping conditions evolve over time. While indices do not predict future rates, they provide transparency into current pricing environments and recent market developments.
The Difference Between Container and Bulk Freight Indices
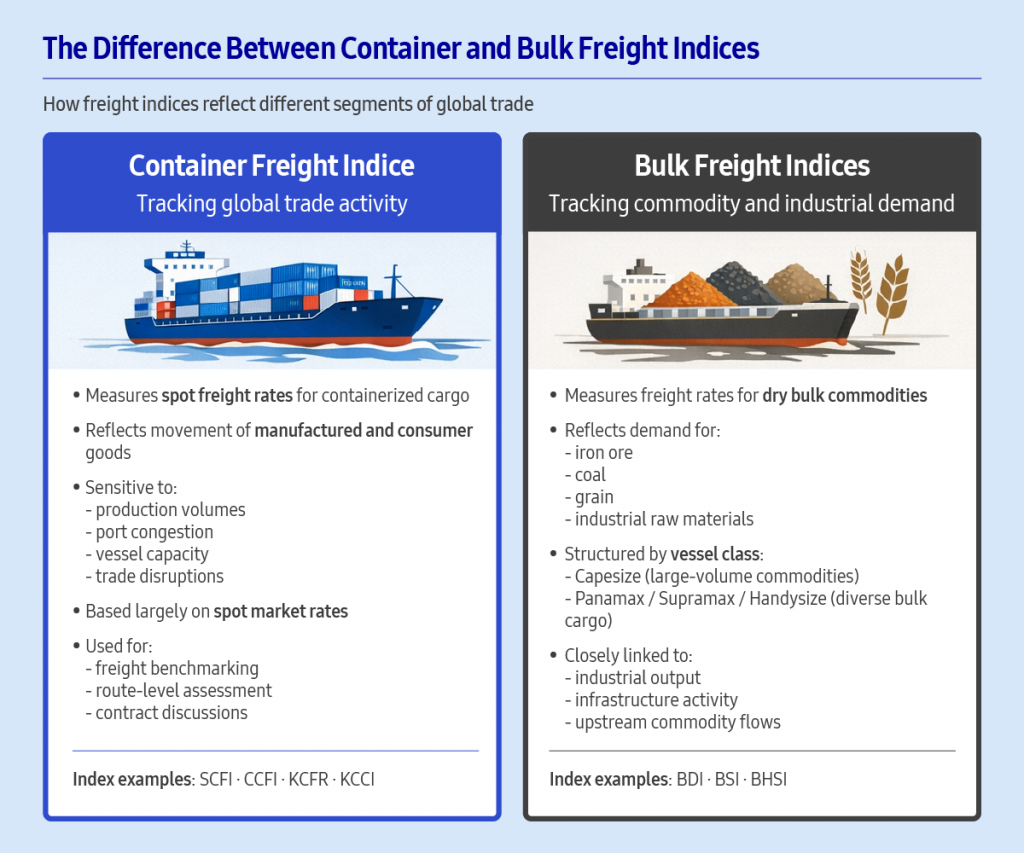
Freight indices broadly fall into two categories: container freight indices and bulk freight indices. While both track movements in shipping costs, they reflect different segments of global trade and respond to different economic drivers. Container freight indices capture changes in the movement of manufactured and consumer goods across global supply chains, while bulk freight indices track the transportation of raw materials and industrial inputs that underpin upstream production and infrastructure activity. Because these cargo types serve different stages of global trade, their respective indices often respond to distinct demand patterns and market conditions.
Container Freight Indices and Global Trade Activity
Container freight indices track spot market freight rates across major trade lanes used to move manufactured goods and consumer products. Indices such as SCFI, CCFI, KCFR, and KCCI aggregate rate data from multiple routes to provide a standardized view of container shipping conditions.
These indices are particularly sensitive to changes in supply and demand across global manufacturing and distribution networks. Shifts in production volumes, port congestion, vessel capacity, and trade disruptions are often reflected quickly in spot container rates, making container indices useful for monitoring short-term changes in trade activity.
Because most container freight indices are based on spot market rates, they tend to capture real-time market dynamics rather than long-term contractual pricing. As a result, they are widely used for benchmarking freight costs, assessing route-level conditions, and supporting contract discussions rather than forecasting future rates.
By tracking movements across key global routes, container freight indices provide insight into how goods are flowing through international supply chains and how logistics conditions are evolving across regions.
Bulk Freight Indices and Commodity Demand Signals
Bulk freight indices track the cost of transporting dry bulk commodities such as iron ore, coal, grain, and other raw materials. Unlike container shipping, bulk transport relies on vessels of varying sizes that serve different segments of global commodity trade.
The Baltic Dry Index (BDI) is one of the most widely referenced bulk freight benchmarks. It reflects freight rates across multiple vessel classes, including Capesize, Panamax, Supramax, and Handysize vessels. Its sub-indices, including BSI and BHSI, track freight rates across different vessel classes used to move raw materials globally.
Each vessel class within bulk indices corresponds to specific cargo types and trade patterns. Larger vessels are typically used for high-volume commodities such as iron ore and coal, while smaller vessels handle a wider mix of agricultural and industrial materials. As a result, bulk freight indices often reflect shifts in raw material demand, infrastructure development, and industrial output rather than consumer demand.
Because bulk shipping is closely tied to upstream economic activity, movements in bulk freight indices are commonly used to assess changes in commodity flows and industrial demand across global markets. These indices provide visibility into the foundational layers of global trade that support manufacturing, construction, and energy production.
Spot Rates, Contract Rates, and Index Sensitivity
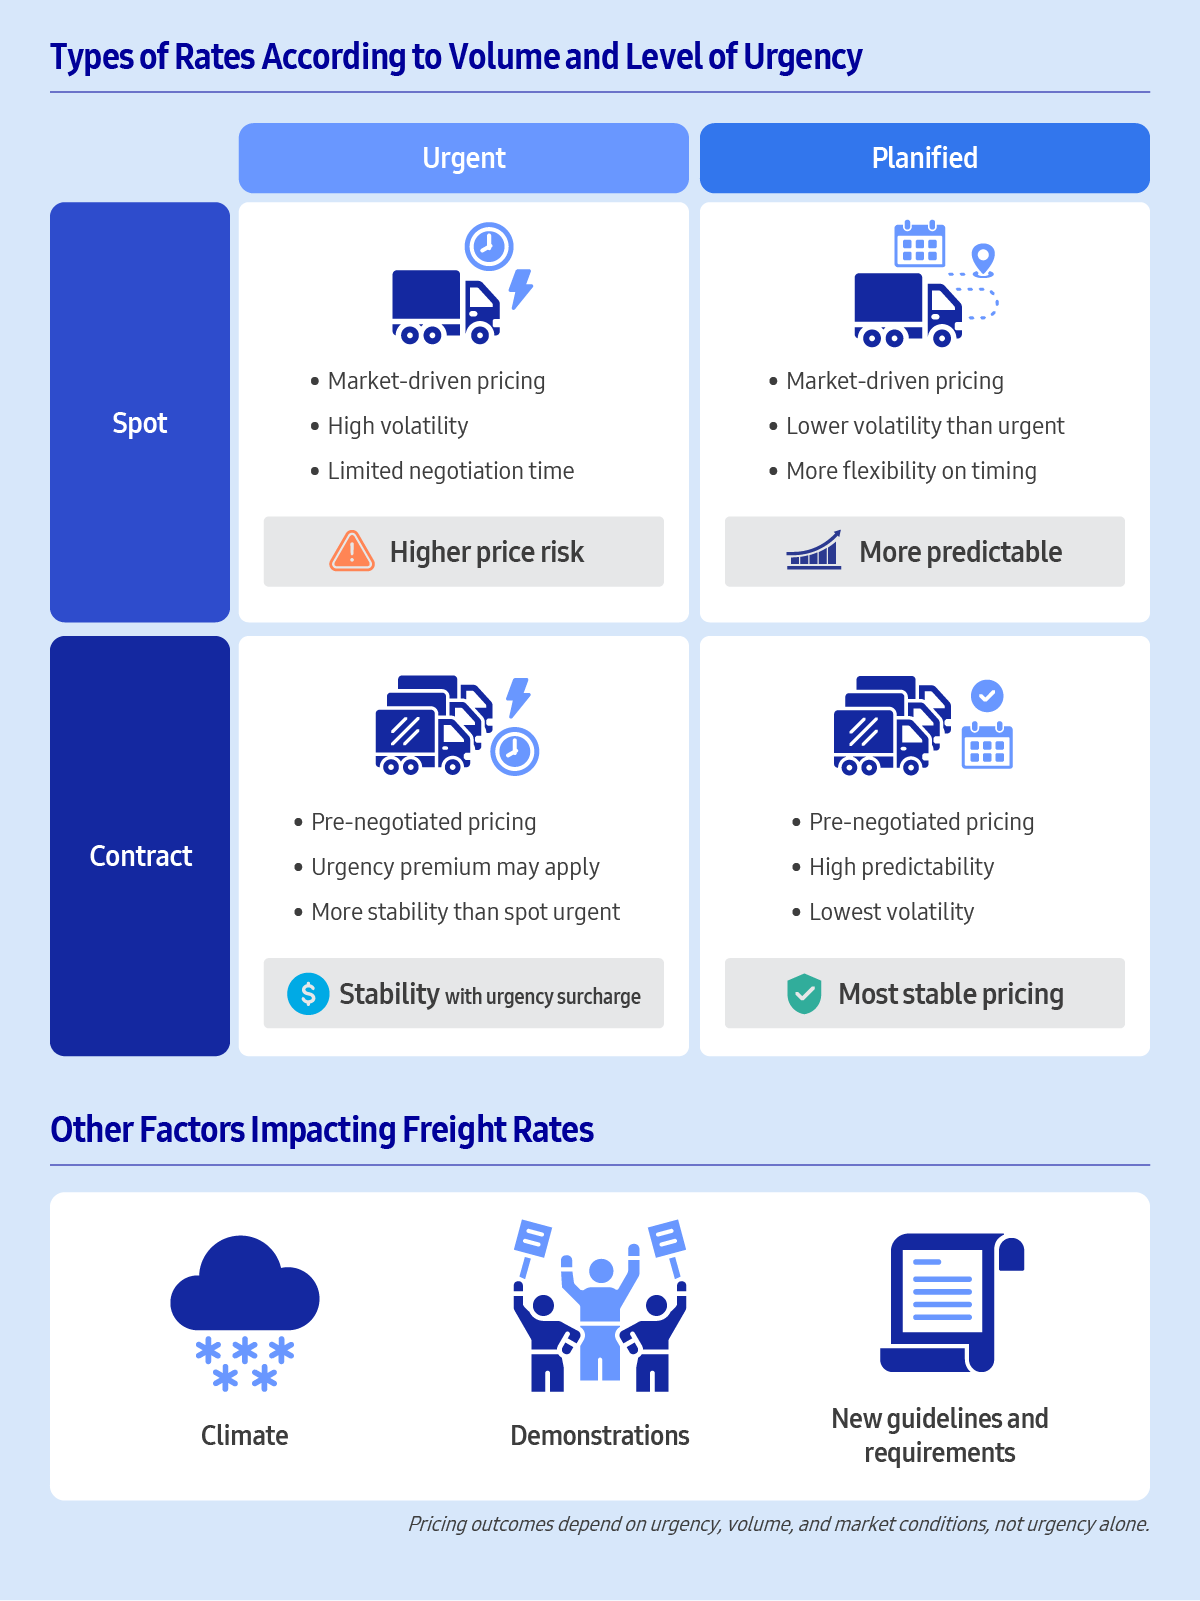
A key characteristic of most freight indices is their reliance on spot market rates. Spot rates apply to individual shipments arranged without long-term agreements and reflect real-time supply and demand conditions. As a result, spot rates tend to be more volatile than contract rates, which are negotiated for longer periods and offer greater cost stability.
In practice, most shippers and trading companies operate with a mix of spot and contract arrangements. Spot rates often serve as reference points during contract negotiations, while contract rates help stabilize logistics costs over time. Because freight indices are primarily based on spot market data, they tend to capture short-term market movements more quickly than contracted pricing structures.
This dynamic explains why freight indices are commonly used for market monitoring and benchmarking rather than direct cost forecasting. By tracking spot-driven index movements, companies can gain early visibility into changing market conditions and adjust procurement, routing, or negotiation strategies accordingly.
Supporting Stability Across Global Trade
Freight indices play a central role in interpreting shipping conditions across containerized and bulk cargo markets. As global trade routes continue to operate under varying capacity levels, congestion patterns, and demand cycles, freight index movements provide structured insight into how shipping environments evolve across regions and commodity flows.
Global trading companies like Samsung C&T Trading & Investment Group track container and bulk freight indices to maintain visibility over shipping conditions affecting both finished goods and upstream commodity flows, where changes in capacity, demand, and operating conditions directly influence logistics environments. This monitoring plays an important role as trading environments continue to face volatility stemming from congestion, capacity shifts, and operational disruption across global shipping networks.
As freight markets continue to experience shifts driven by operational constraints and changing trade dynamics, freight indices remain an established reference for maintaining visibility across global trade flows.