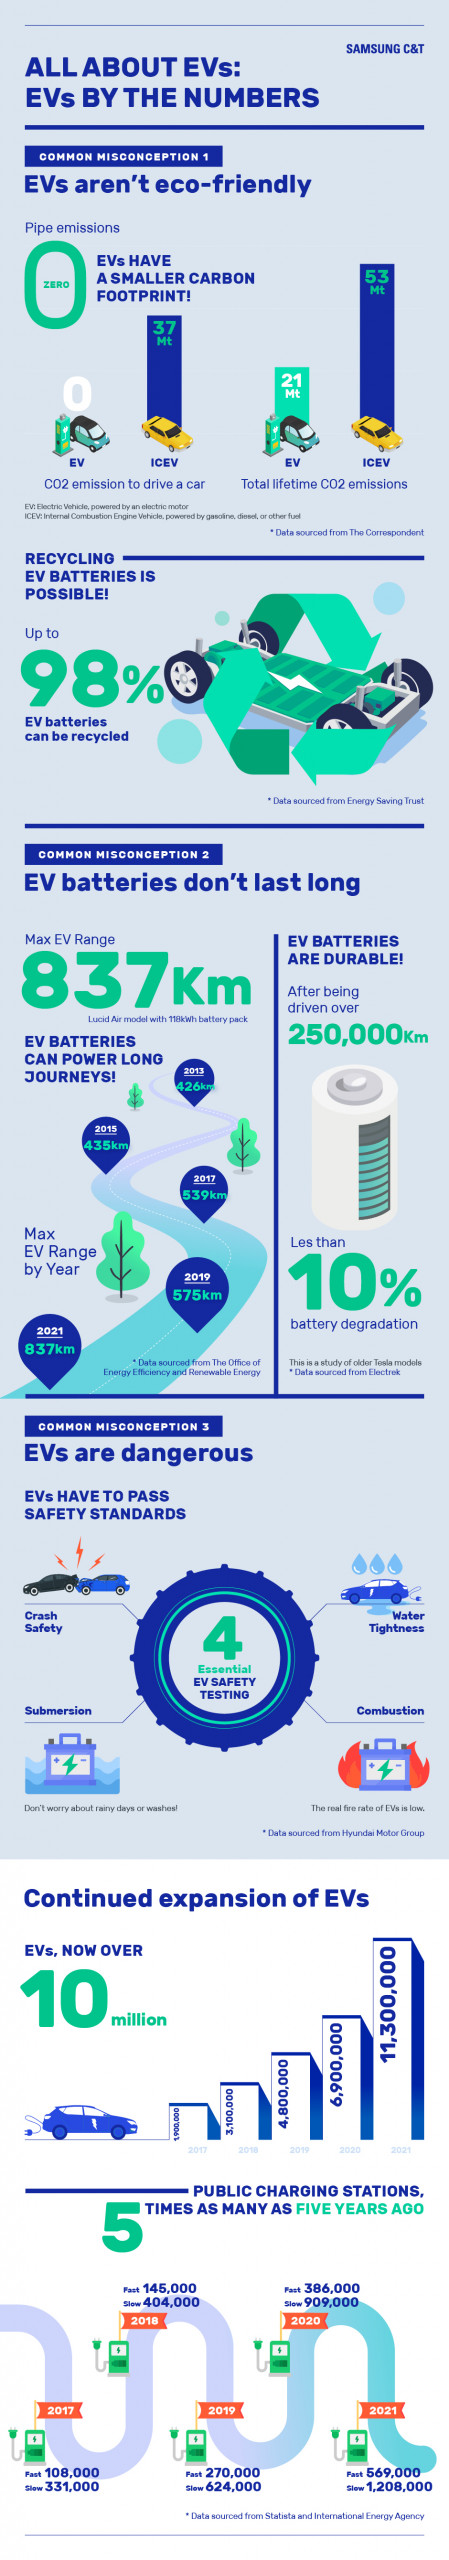
EVs by the numbers
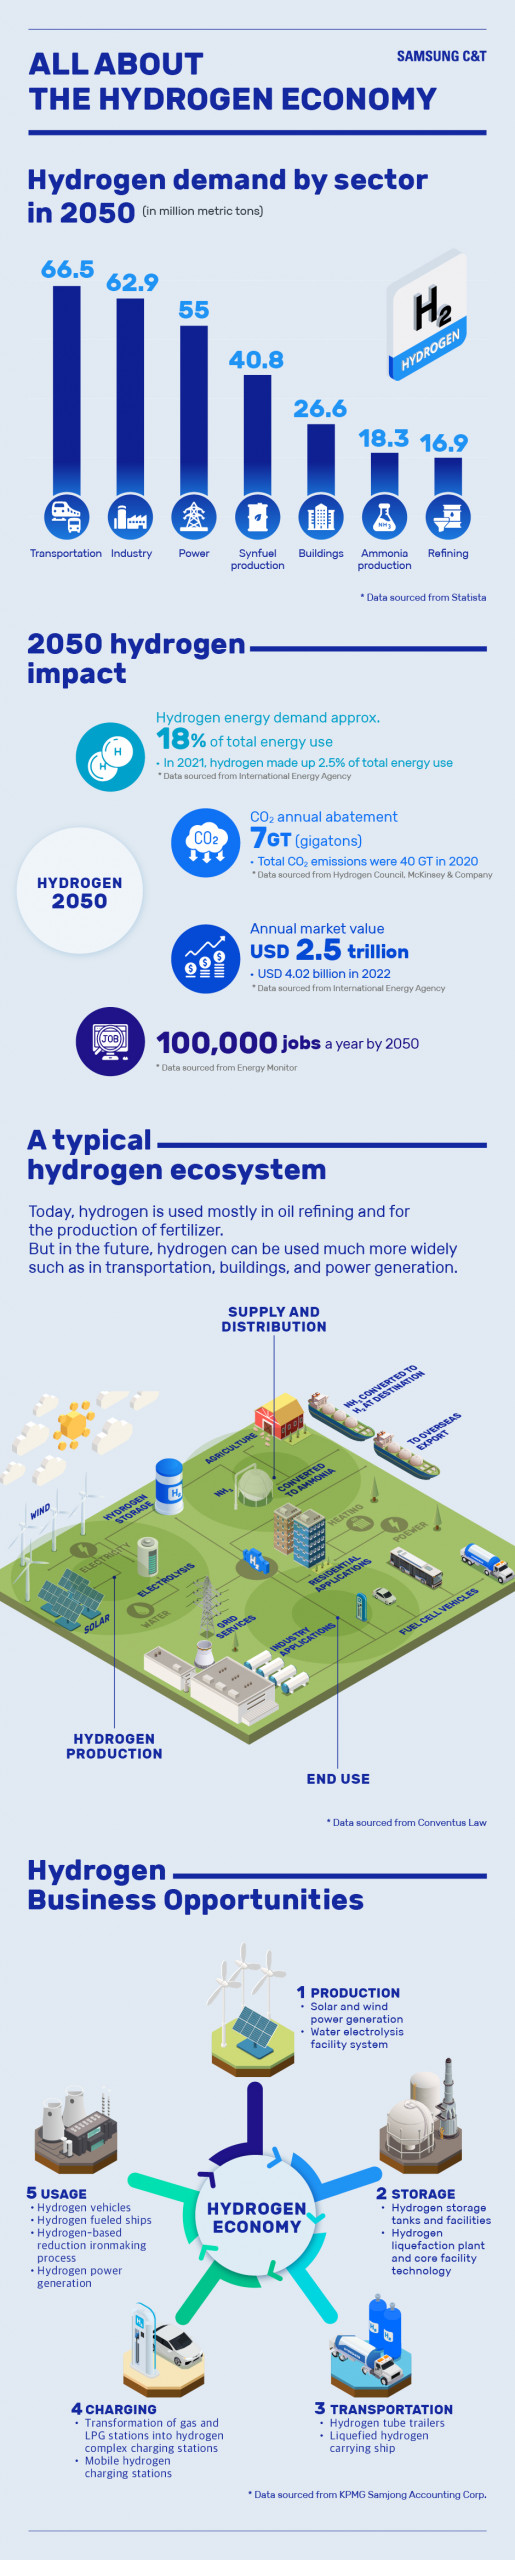
In the future, hydrogen can be used much more widely such as in transportation, buildings, and power generation.
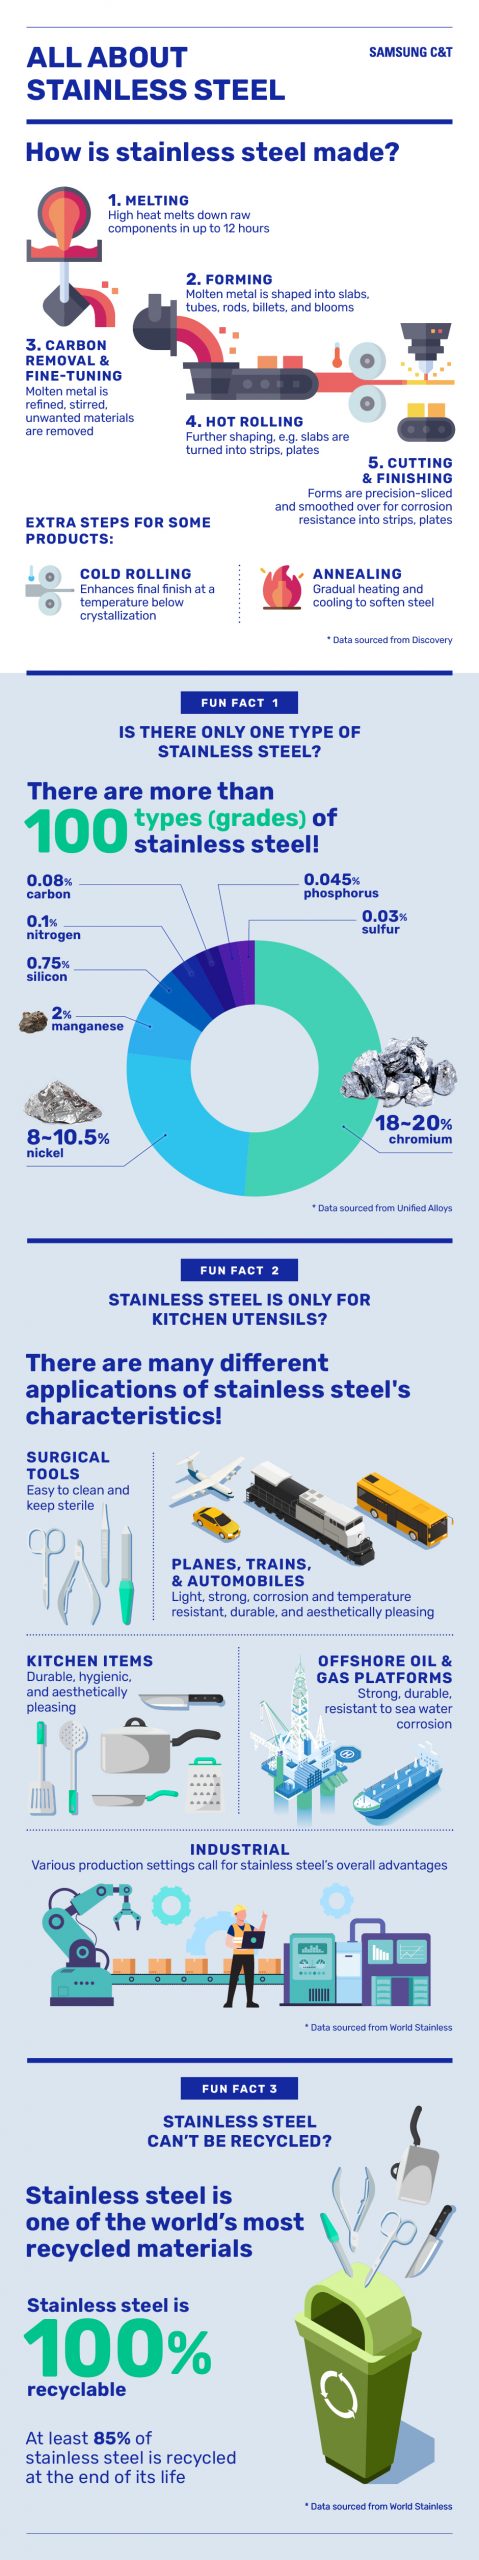
How is stainless steel made?
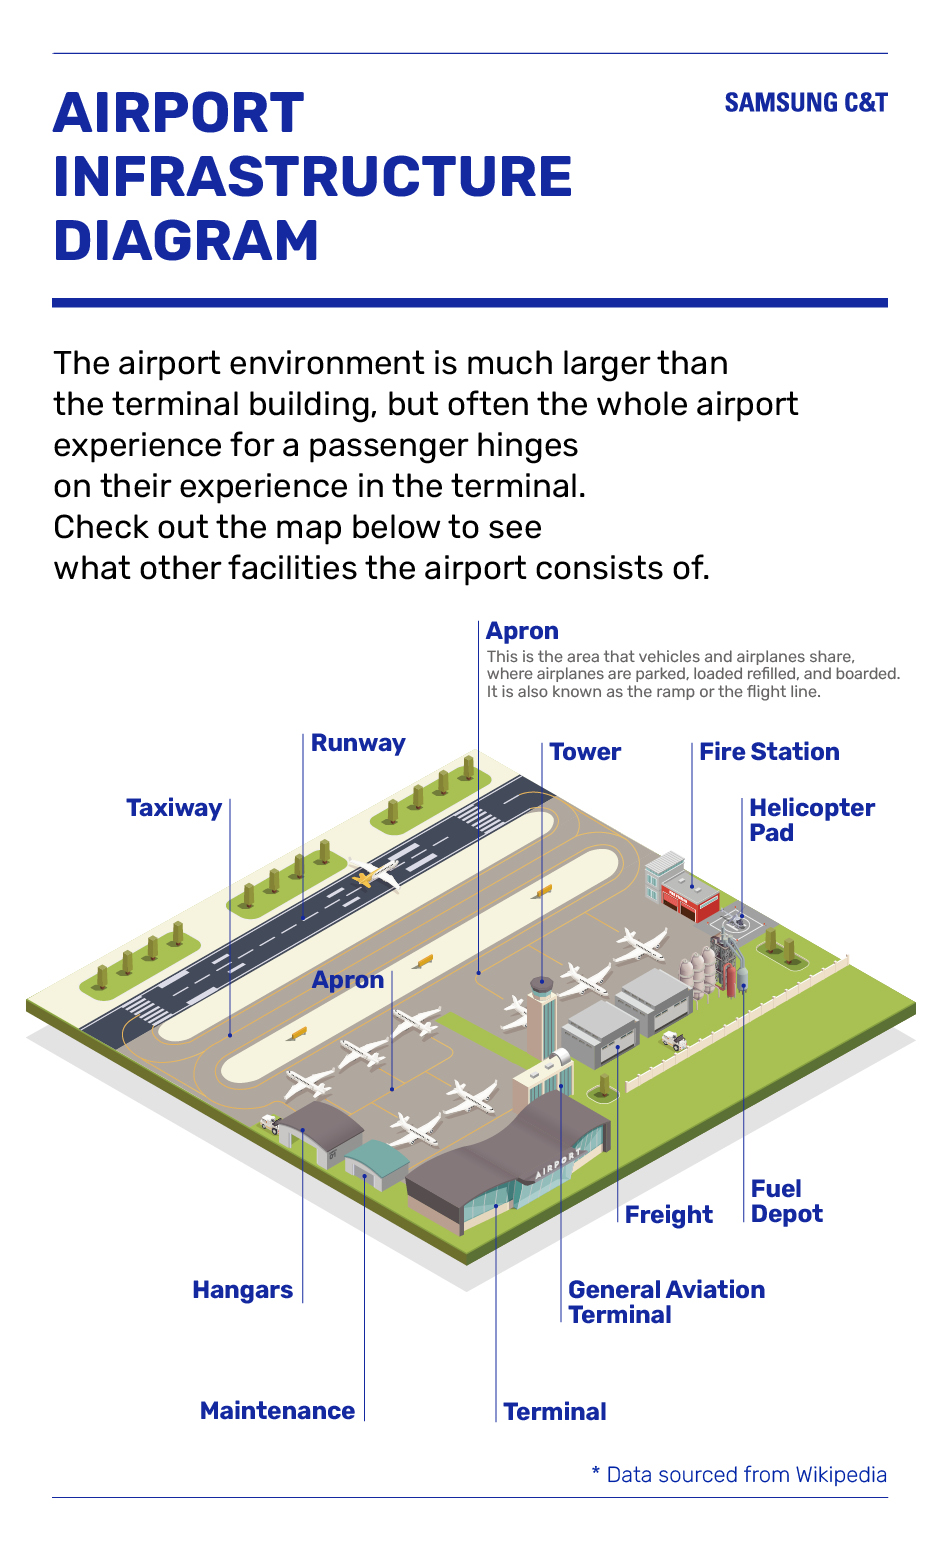
The airport environment is much lager than the terminal building.
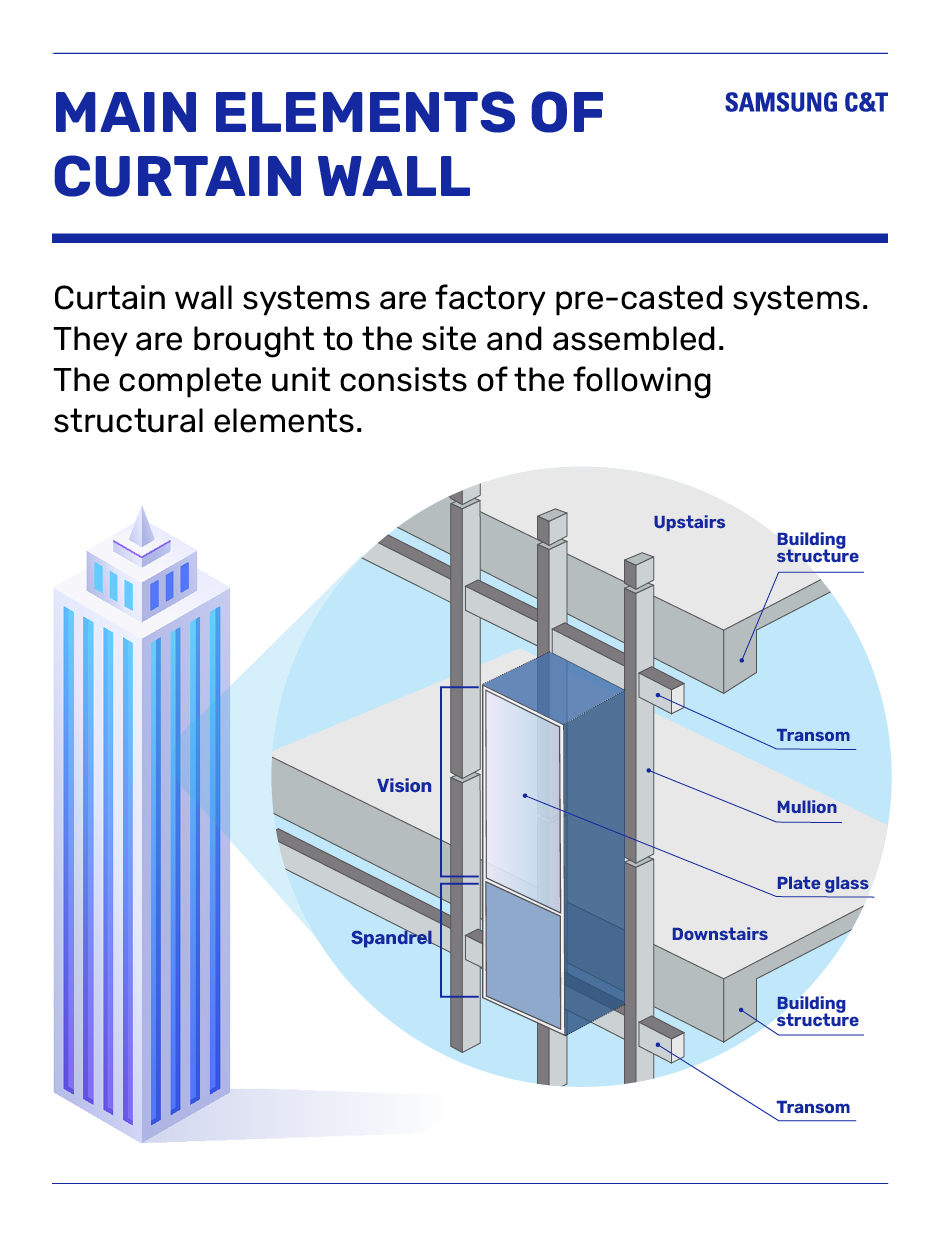
Curtain wall systems are factory pre-casted systems.
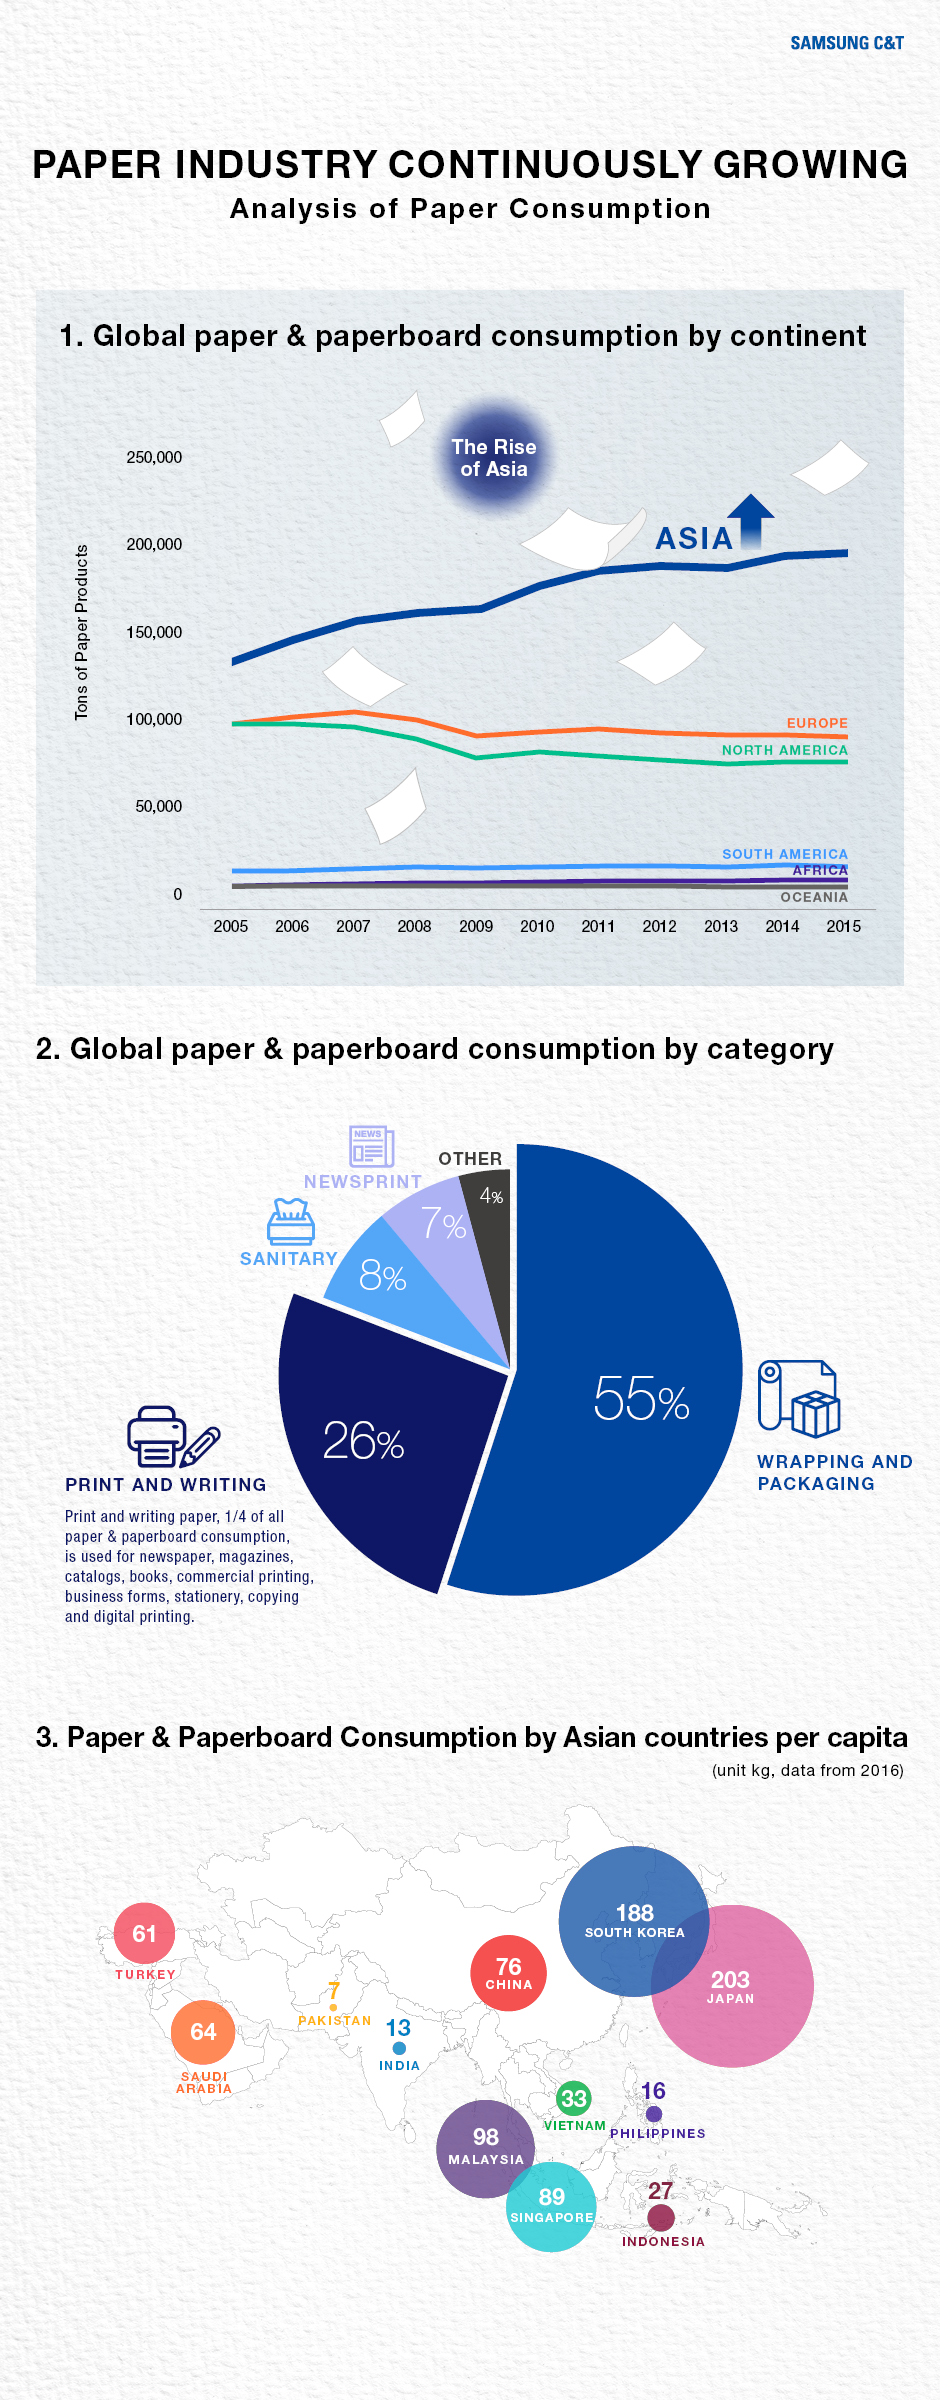
Analysis of Paper Consumption
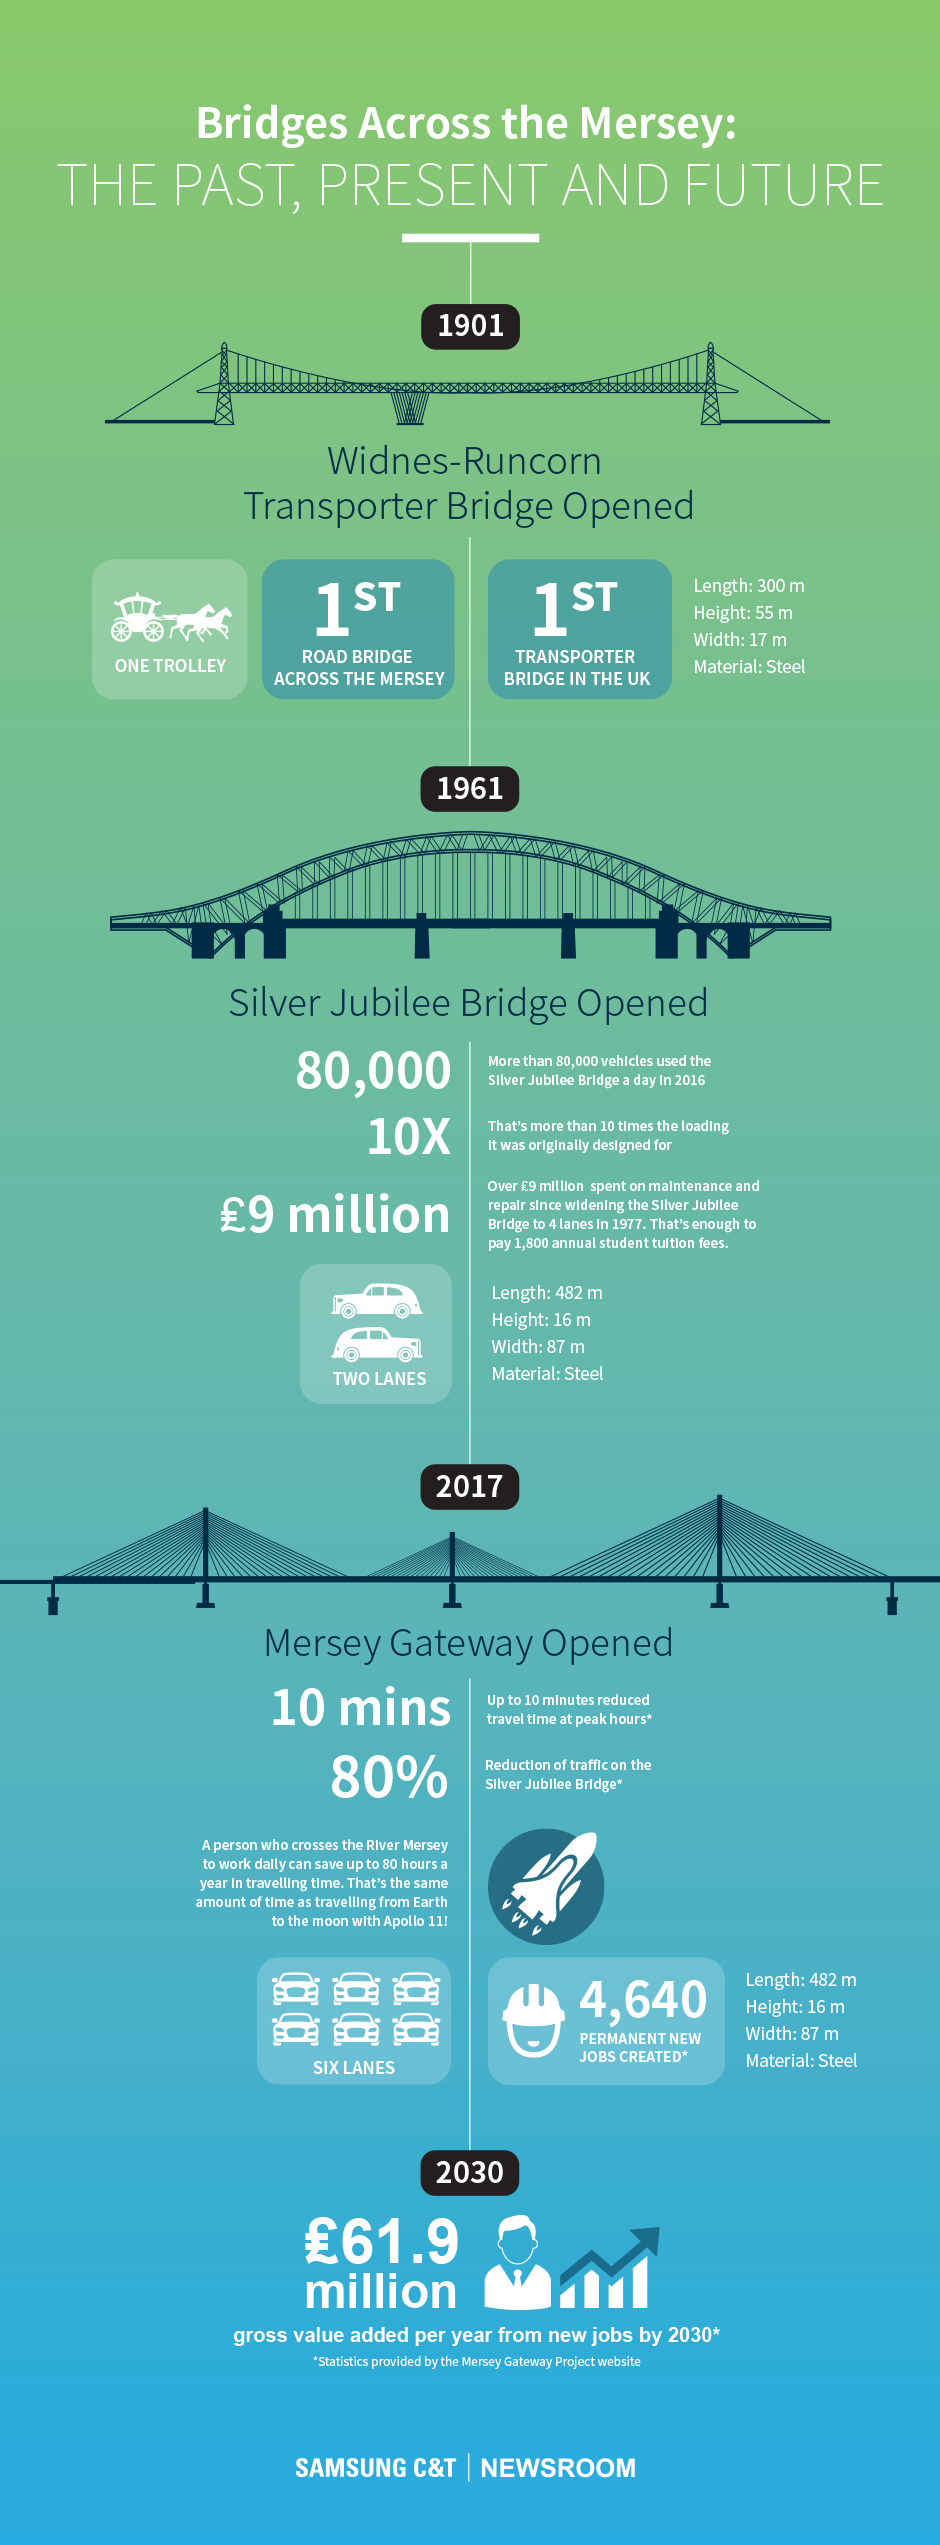
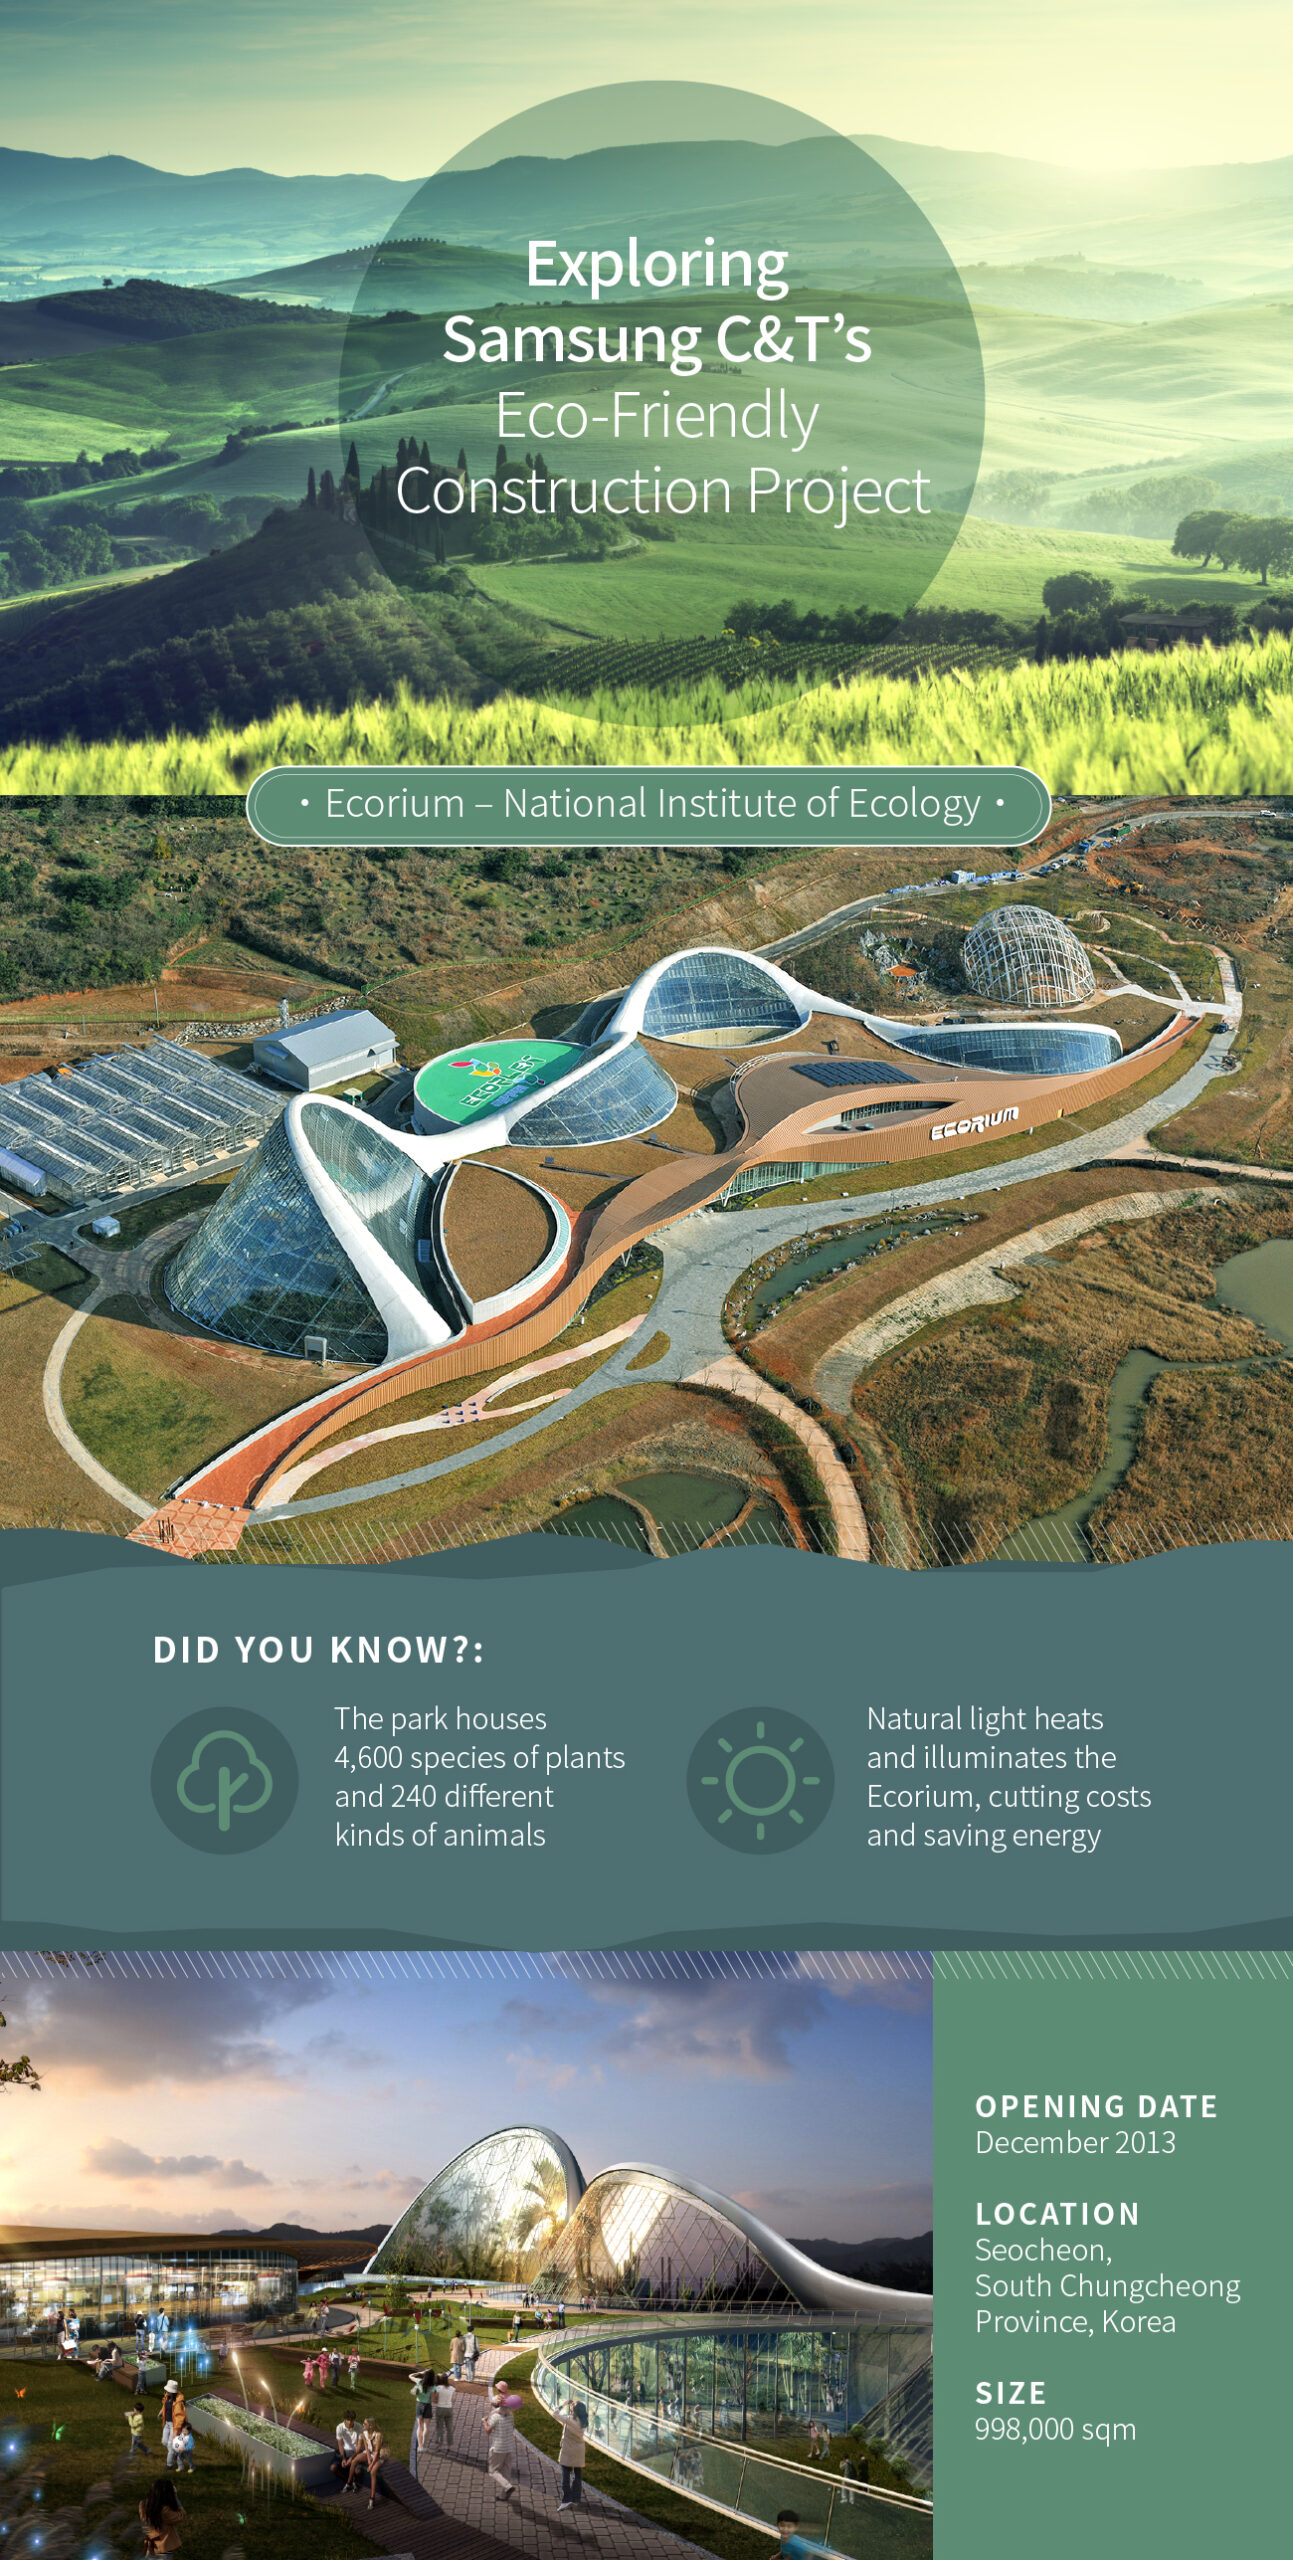
The past, present and future
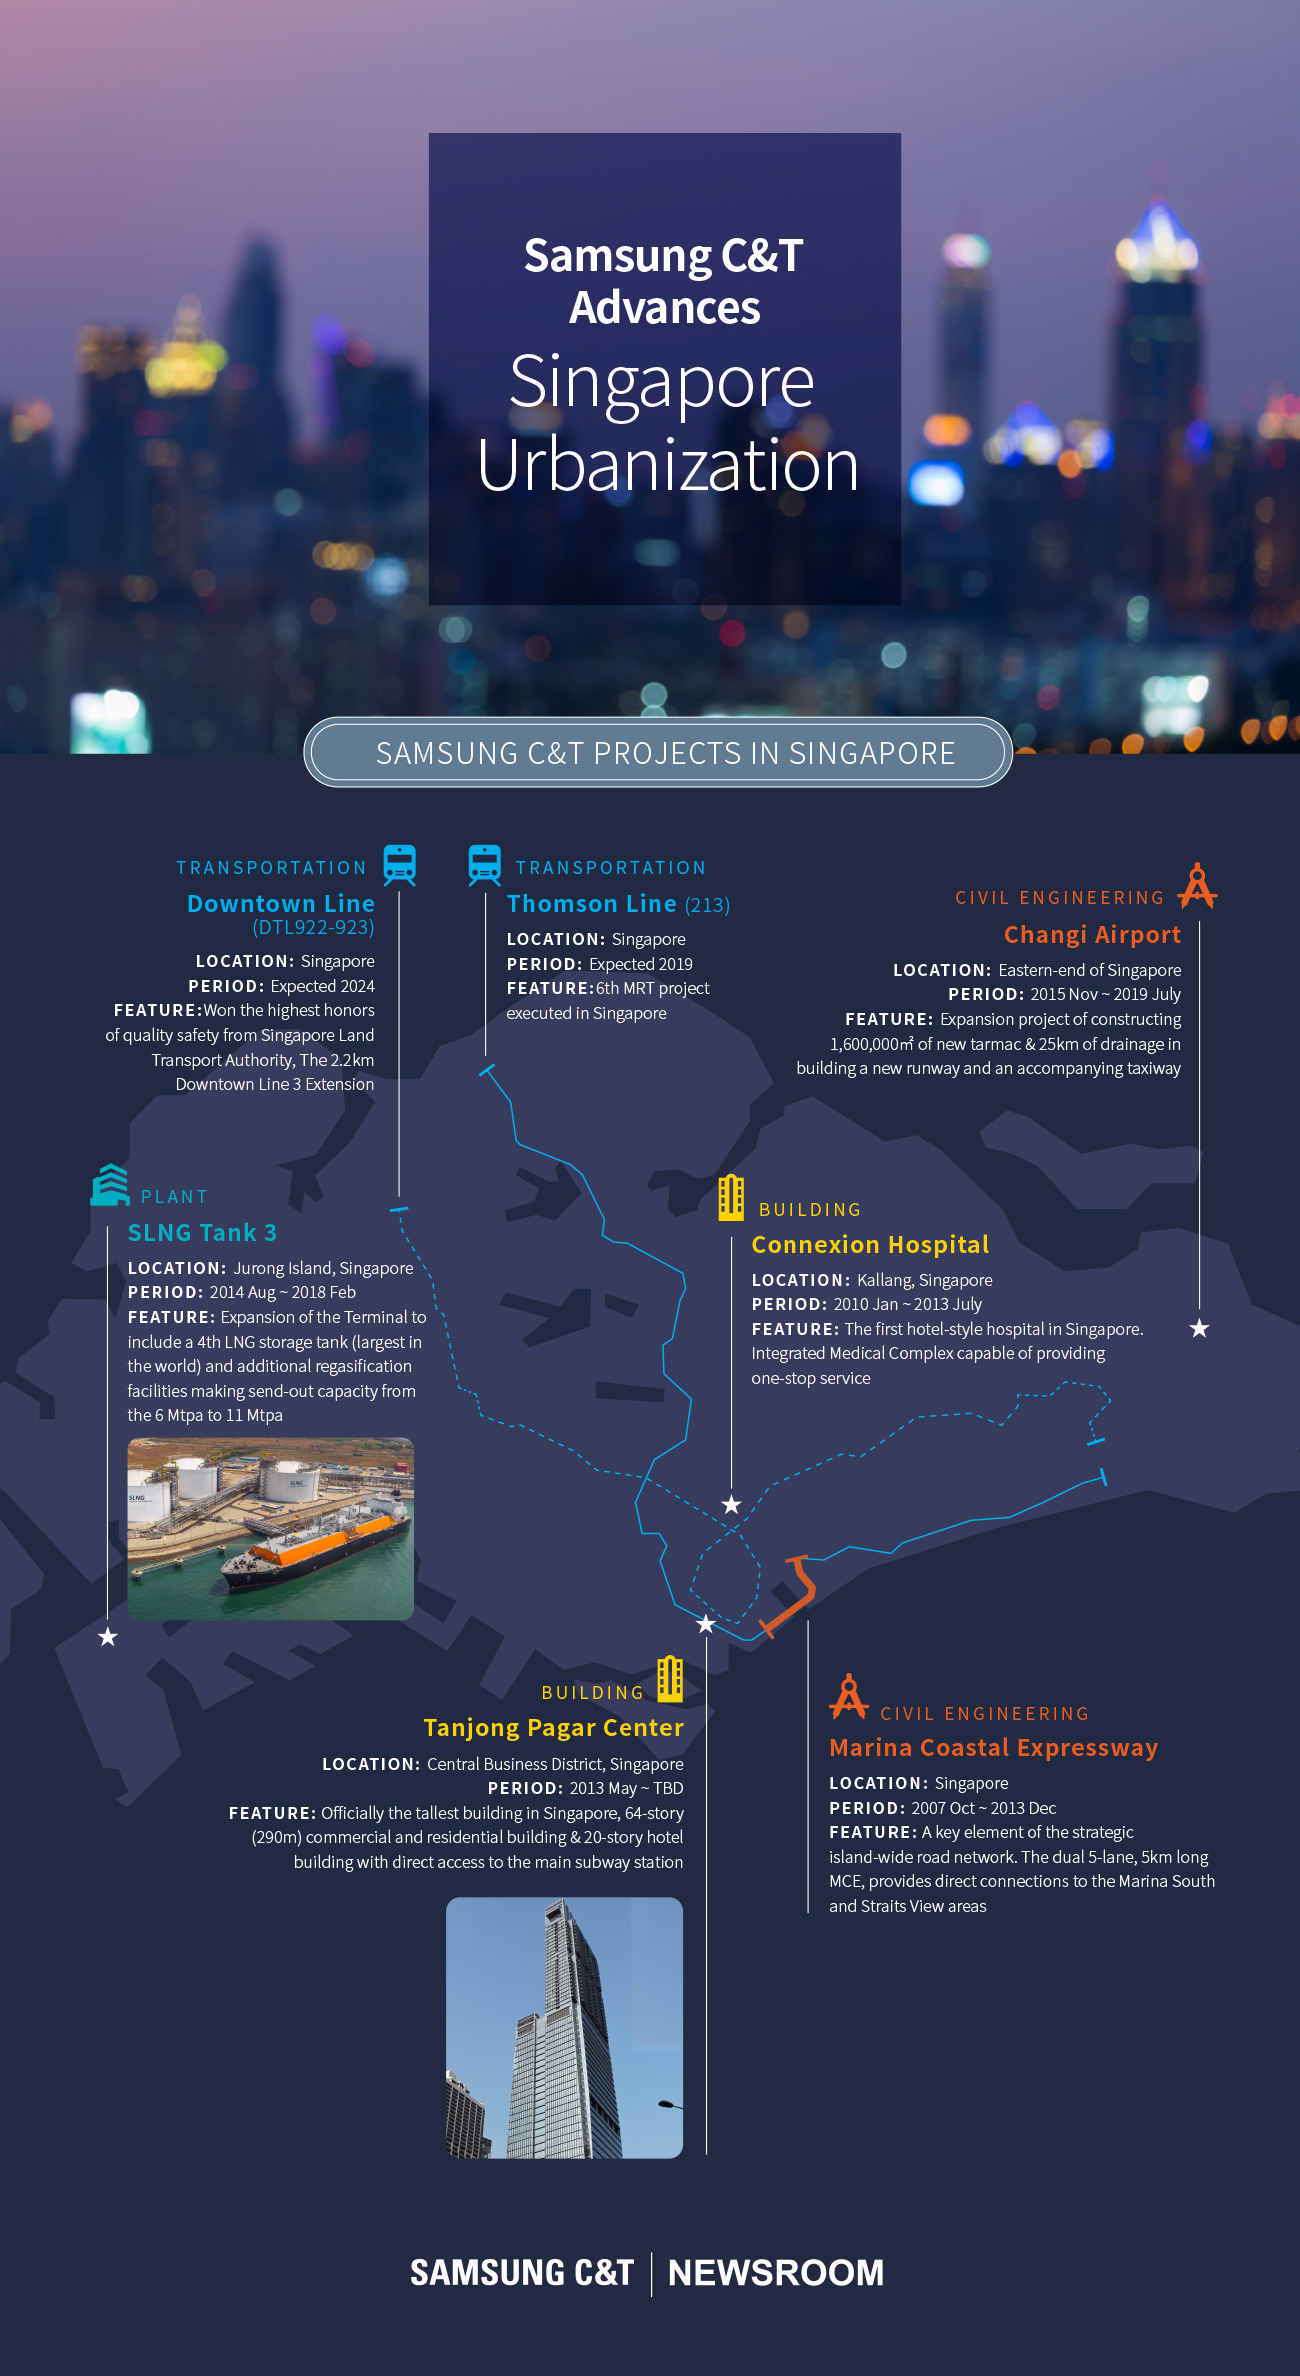
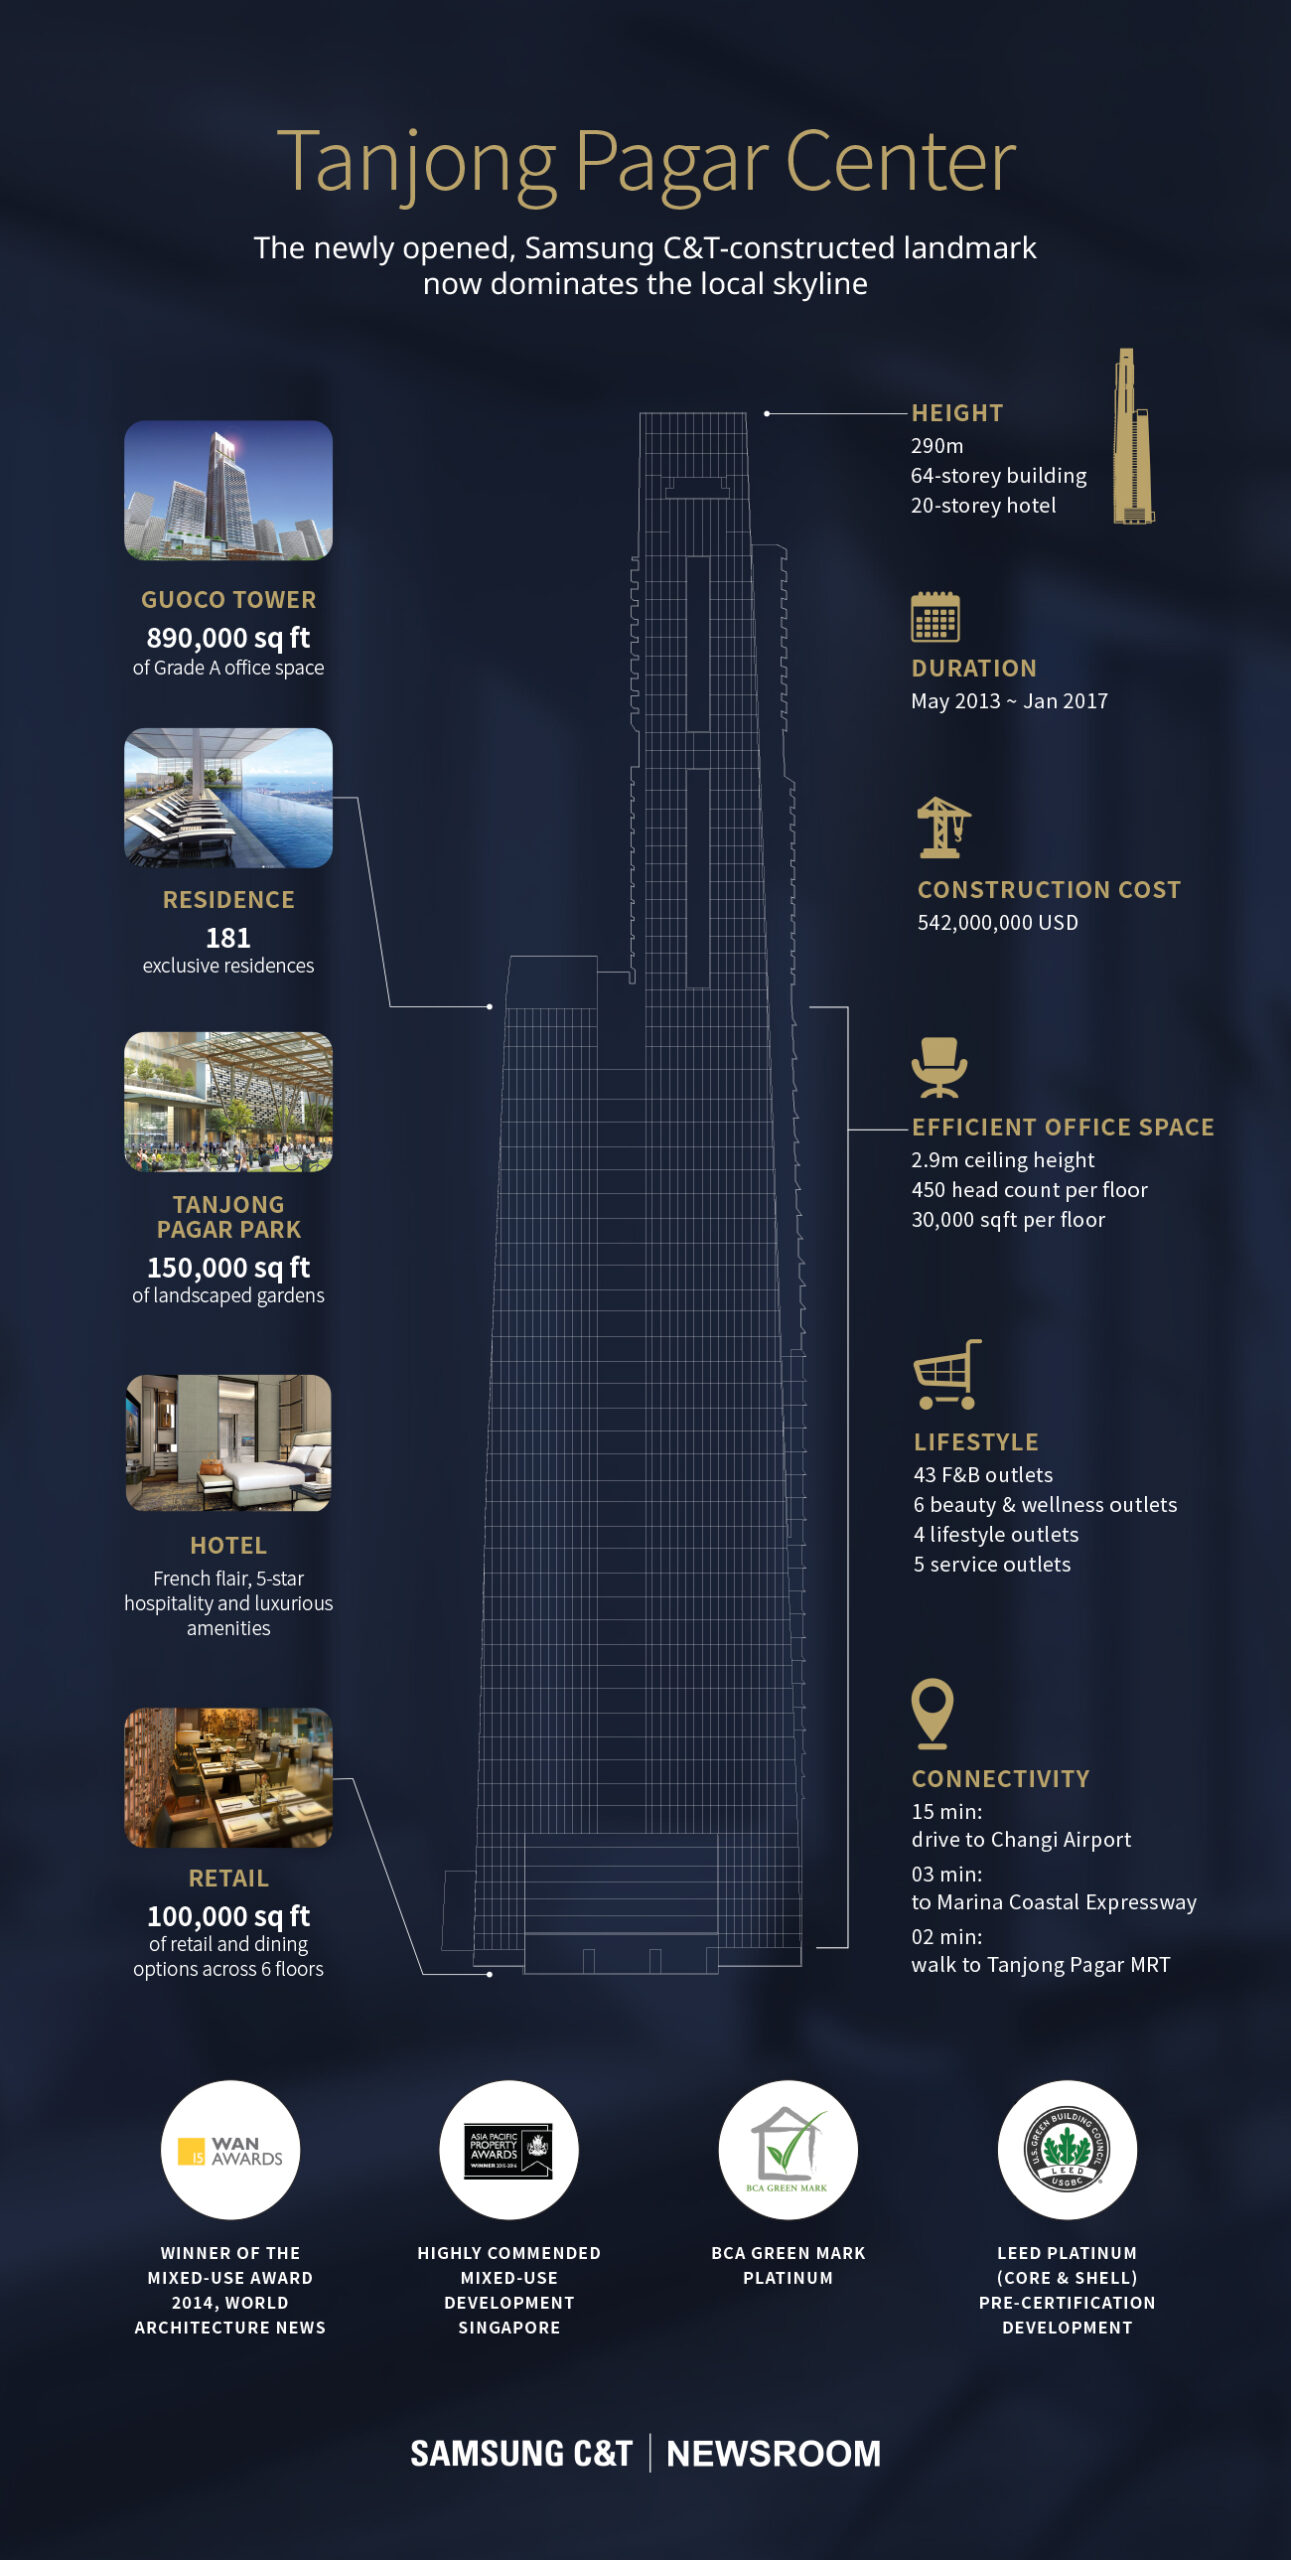
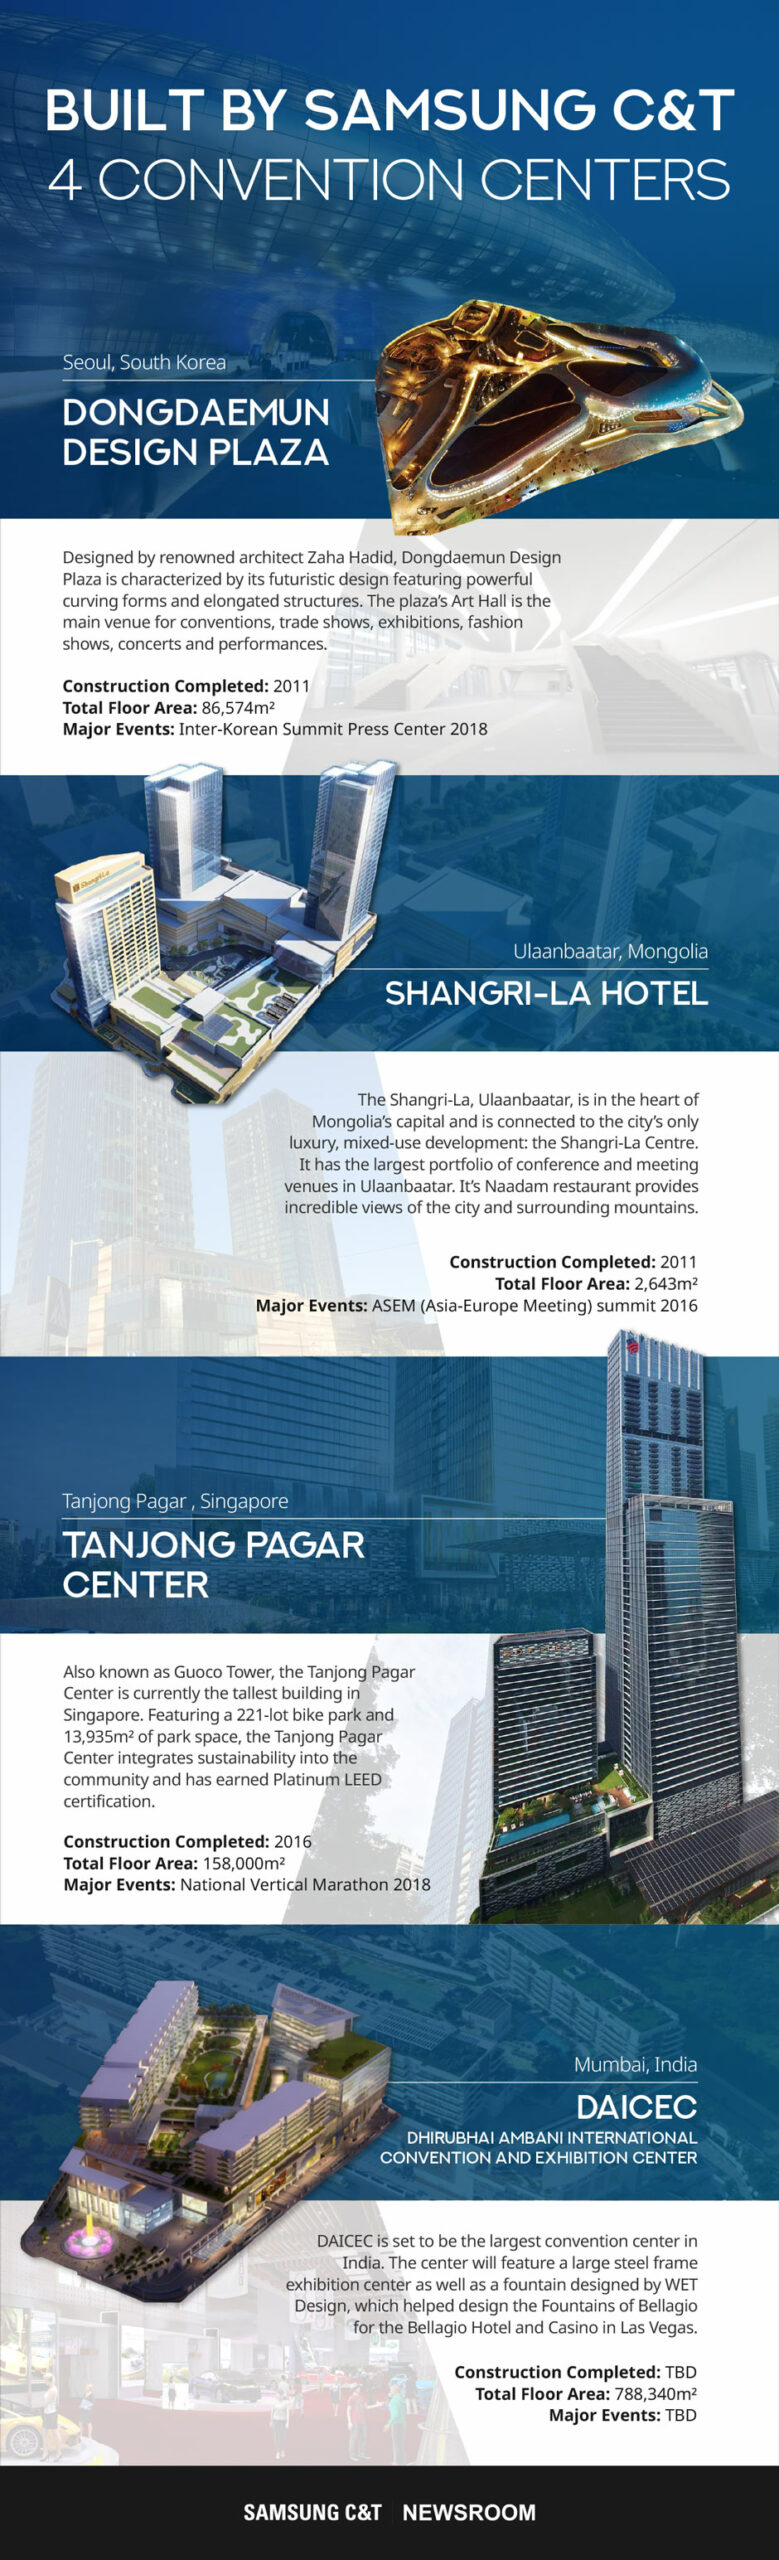
Samsung C&T Projects in Singapore
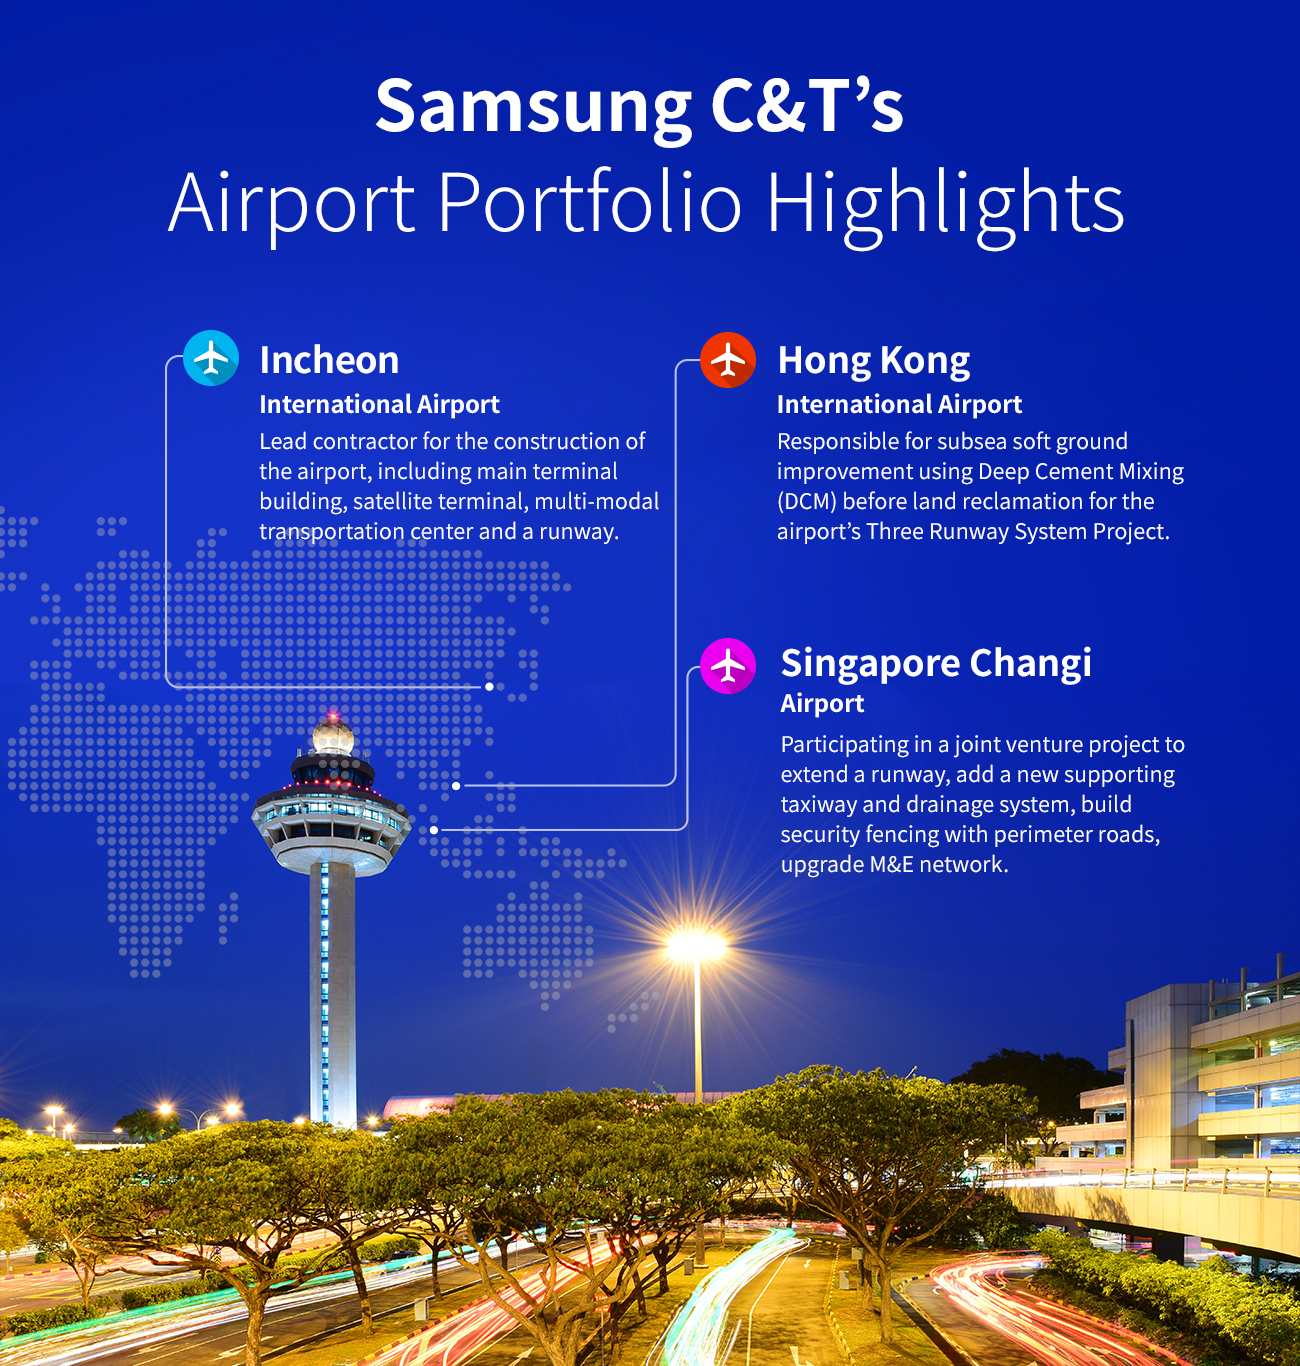
Incheon, Hong Kong, Singapore
The newly opened, Samsung C&T constructed landmark now dominates the local skyline
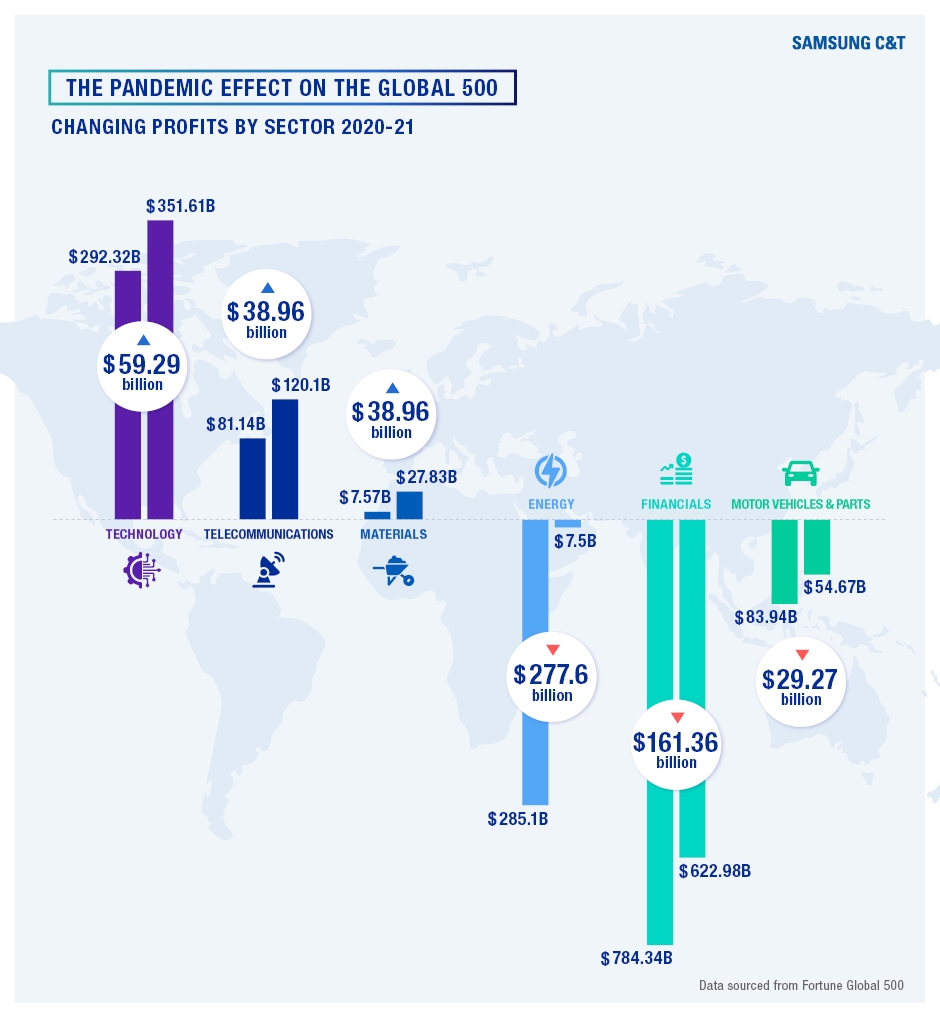
Changing profits by sector 2020-21
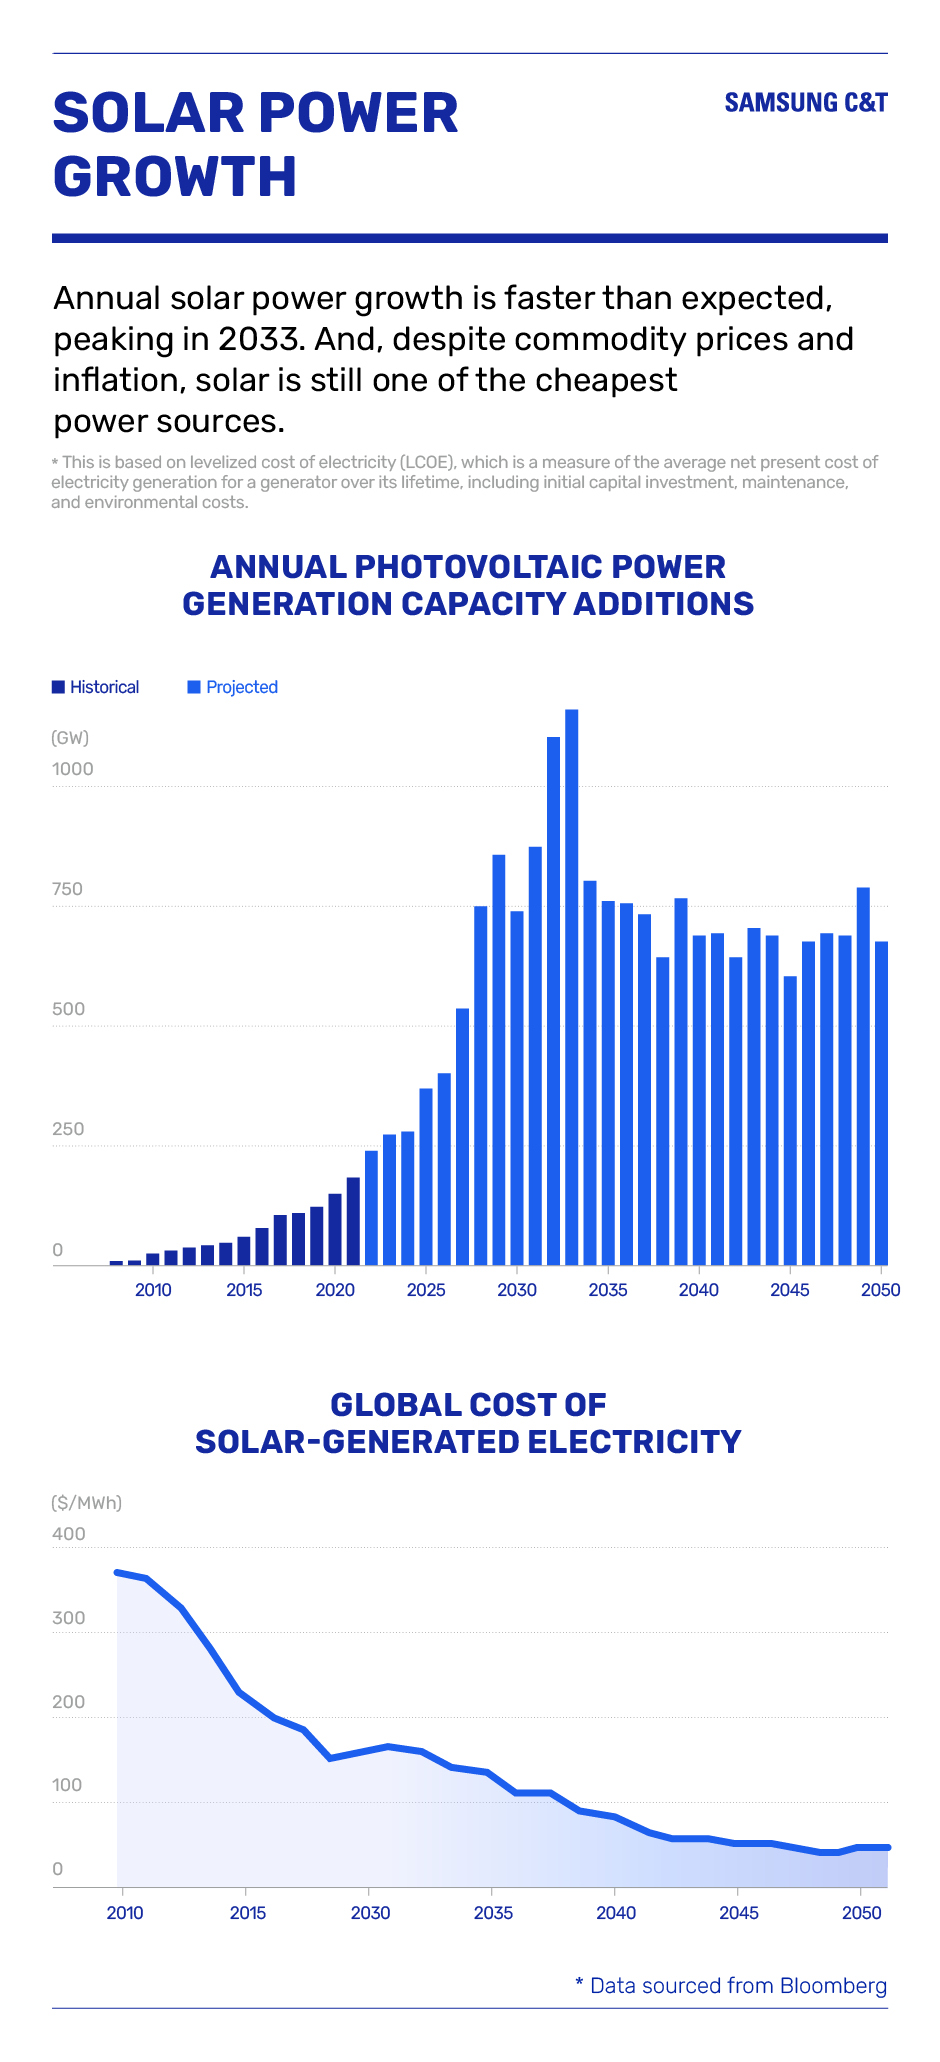
Annual solar power growth is faster than expected, peaking in 2033. And, despite commodity prices and inflation, solar is still one of the cheapest power sources.
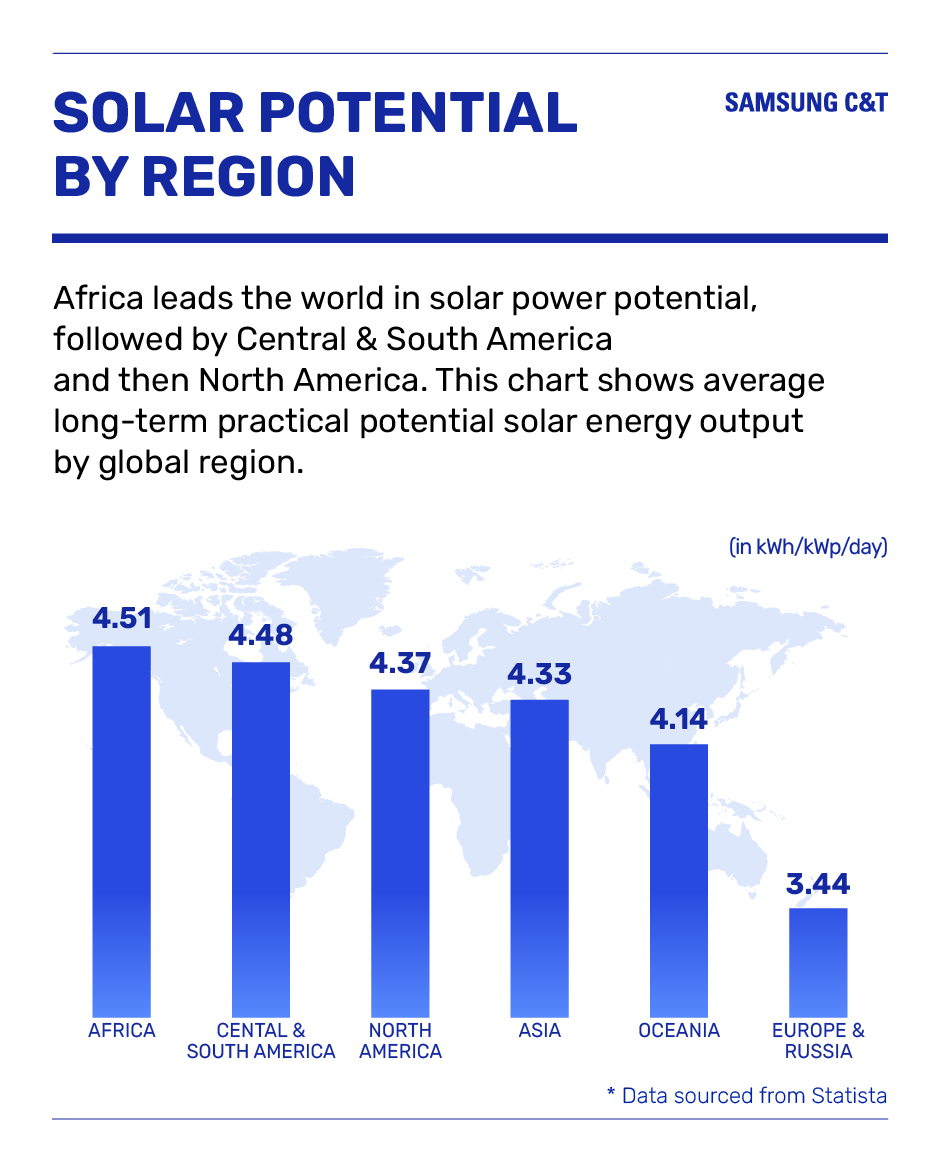
Africa leads the world in solar power potential, followed by Central & South America and then North America. This chart shows average long-term practical potential solar energy output by global region.