Samsung C&T posted KRW 34.455Tn in revenue and KRW 1.196Tn in operating profit for FY 2021 on the back of continued steady growth through strengthening business competitiveness and enhancing management efficiency.
The company saw both revenue and operating profit increase in Q4 2021 compared to a year earlier, mainly due to improved profitability in the Trading & Investment Group and the Fashion Group, among other factors.
For FY 2022, Samsung C&T has set its revenue target at KRW 34.9Tn along with KRW 11.7Tn in new orders. The company will continue to make efforts to promote solid growth centered on profitability.
Samsung C&T is expected to enjoy stable growth this year as high-quality projects won by the Engineering & Construction Group have begun in earnest while the Trading & Investment Group and the Fashion Group maintain profitability. In addition, the company will continue to make efforts to secure new business opportunities in areas such as the bio and eco-friendly fields to enhance its overall performance.
FY 2021 Earnings
Overall Performance
Revenue: KRW 34.455Tn, up KRW 4.239Tn (14%↑) from KRW 30.216Tn in FY 2020
Operating Profit: KRW 1.196Tn, up KRW 339Bn (39.6%↑) from KRW 857Bn in FY 2020
Both revenue and operating profit increased year-on-year due to the strengthened business competitiveness of the Trading & Investment Group, improved management efficiency of the Fashion Group, and stable growth of the Bio subsidiary.
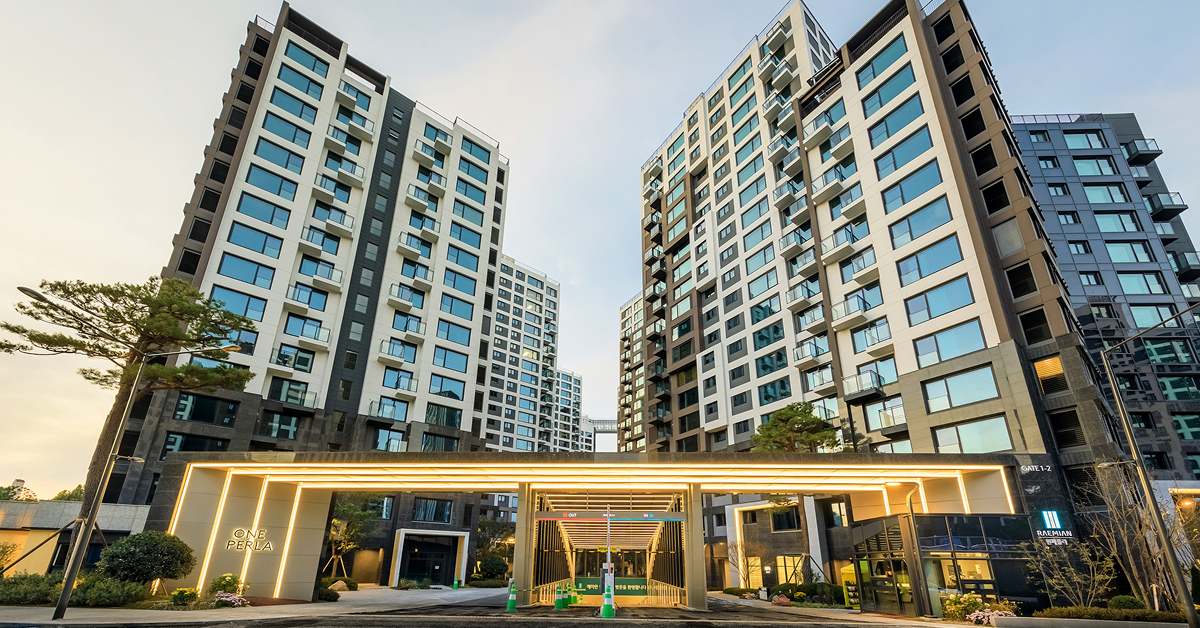
Engineering & Construction Group
Revenue: KRW 10.989Tn, down KRW 713Bn (6.1%↓) from KRW 11.702Tn in FY 2020
Operating Profit: KRW 251Bn, down KRW 280Bn (52.7%↓) from KRW 531Bn in FY 2020
New Orders: KRW 13Tn, exceeding 21% of KRW 10.7Tn target in 2021
The group’s profit declined due to temporary losses caused by increased construction costs affecting its domestic thermal power generation project in Q3 2021, while orders exceeded the annual target of KRW 10.7Tn by 21%.
Trading & Investment Group
Revenue: KRW 17.354Tn, up KRW 4.102Tn (31%↑) from KRW 13.252Tn in FY 2020
Operating Profit: KRW 296Bn, up KRW 202Bn (214.9%↑) from KRW 94Bn in FY 2020
The group’s revenue and operating profit rose due to the rising price of raw materials and improved profitability through strengthening its global trading capabilities.
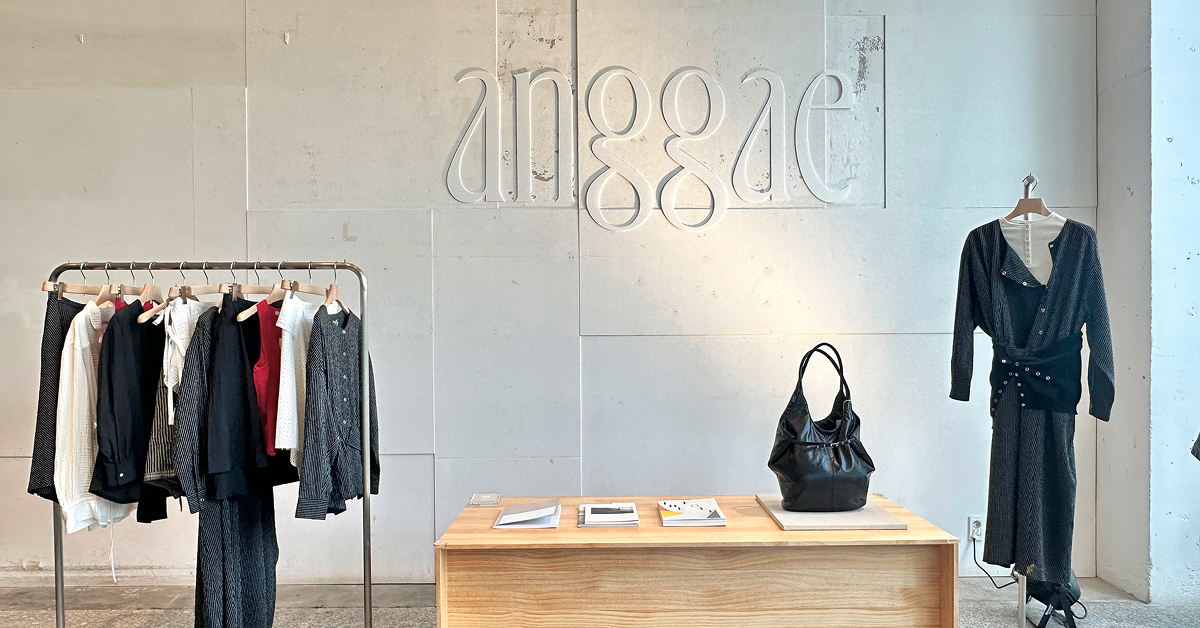
Fashion Group
Revenue: KRW 1.767Tn, up KRW 222Bn (14.4%↑) from KRW 1.545Tn in FY 2020
Operating Profit: KRW 100Bn, up KRW 136Bn (377.8%↑) from KRW 36Bn loss in FY 2020
The group’s revenue and operating profit grew due to the recovery of consumer sentiment, structural improvement through management efficiency, and strong sales involving imported brands and online businesses
Resort Group
Revenue: KRW 2.777Tn, up KRW 224Bn (8.8%↑) from KRW 2.553Tn in FY 2020
Operating Profit: KRW 57Bn, up KRW 36Bn (171.4%↑) from KRW 21Bn in FY 2020
The group’s revenue and operating profit increased due to the recovery of demand in the leisure industry and the strength of its golf business.
Q4 2021 Performance
Overall Performance
Revenue: KRW 9.765Tn, up KRW 1.583Tn (19.4%↑) from KRW 8.182Tn in Q4 2020
Operating Profit: KRW 327Bn, up KRW 71Bn (27.7%↑) from KRW 256Bn in Q4 2020
Engineering & Construction Group
Revenue: KRW 3.148Tn, up KRW 37Bn (1.2%↑) from KRW 3.111Tn in Q4 2020
Operating Profit: KRW 133Bn, down KRW 2Bn (1.5%↓) from KRW 135Bn in Q4 2020
Trading & Investment Group
Revenue: KRW 4.917Tn, up KRW 1.301Tn (36%↑) from KRW 3.616Tn in Q4 2020
Operating Profit: KRW 40Bn, up KRW 28Bn (233.3%↑) from KRW 12Bn in Q4 2020
Fashion Group
Revenue: KRW 526Bn, up KRW 56Bn (11.9%↑) from KRW 470Bn in Q4 2020
Operating Profit: KRW 20Bn, up KRW 11Bn (122.2%↑) from KRW 9Bn in Q4 2020
Resort Group
Revenue: KRW 730Bn, up KRW 120Bn (19.7%↑) from KRW 610Bn in Q4 2020
Operating Profit: Operating Profit: KRW 17Bn, down KRW 1Bn (5.6%↓) from KRW 18Bn in Q4 2020


