The world is undergoing a significant shift to renewable energy to mitigate the impact of climate change. This article provides a brief overview of trends in three major markets in the transition towards renewable energy. Renewable energy in the U.S. comprised 22% of its total power generation in 2022. China still relies heavily on coal but is rapidly expanding its renewable energy capacity, particularly solar and wind. In 2023, Europe experienced a 19% decrease in fossil fuels in its total energy sources and aims for 32% of total energy consumption to come from renewables by 2030.
The world is facing a major shift to renewable energy through the global energy transition. The growing impacts of climate change are exacerbating the need for a swift transition to cleaner energy sources. The energy sector is playing a key role in reducing global emissions and achieving the goals of the Paris Agreement. Already signed by 196 parties, the Paris Agreement is a unanimous agreement to reduce carbon emissions to “limit the temperature increase to 1.5°C above pre-industrial levels.” To achieve this climate goal, “greenhouse gas emissions must peak before 2025 at the latest and decline 43% by 2030” according to the United Nations.
Fossil fuels contributed a total of 36.6 billion tons of CO2 emissions in 2022 according to Carbon Brief, a UK-based climate science website. The transition to relying less on fossil fuels and moving towards renewable energy sources has made progress over the last 10 years. However, a lot more needs to be done to address the underlying issues that are keeping us away from our climate goals.
Reducing our dependency on fossils fuels, increasing renewable energy solutions, and adopting low-carbon technologies are a global priority. This article outlines what the global energy transition is and an overview of how three major markets, the U.S., China, and Europe, are addressing the transition to renewable energy and reducing carbon emissions.
What is the Global Energy Transition?
The global energy transition is seeing countries worldwide shift to relying less on greenhouse gas-emitting fossil fuels and pushing to increase renewable energy consumption. The global energy transition aims to reduce greenhouse gas emissions to reduce the environmental, economic, and social impacts of climate change.
Since the Paris Agreement was implemented in 2016, countries have made progress toward establishing low-carbon solutions and setting carbon neutrality targets. Shifting to renewable energy sources such as wind, hydropower, and solar power are key solutions for the global energy transition.
Transitioning Away from Fossil Fuels
The demand for oil is starting to slow down as countries make the transition to cleaner energy sources such as solar and wind. According to a 2023 report by McKinsey and Company, demand for oil across the globe is expected to steeply decline by 2030. Sectors still relying heavily on oil include chemical industries, heavy trucking, and aviation. According to the International Energy Agency’s (IEA) latest Oil Outlook Report, published in June 2024, fast-growing economies in Asia and the demand from aviation and petrochemical sectors are set to drive oil usage in the coming years. It is predicted that this demand will be balanced out by more electric cars, better fuel efficiency, and less oil use in electricity generation.
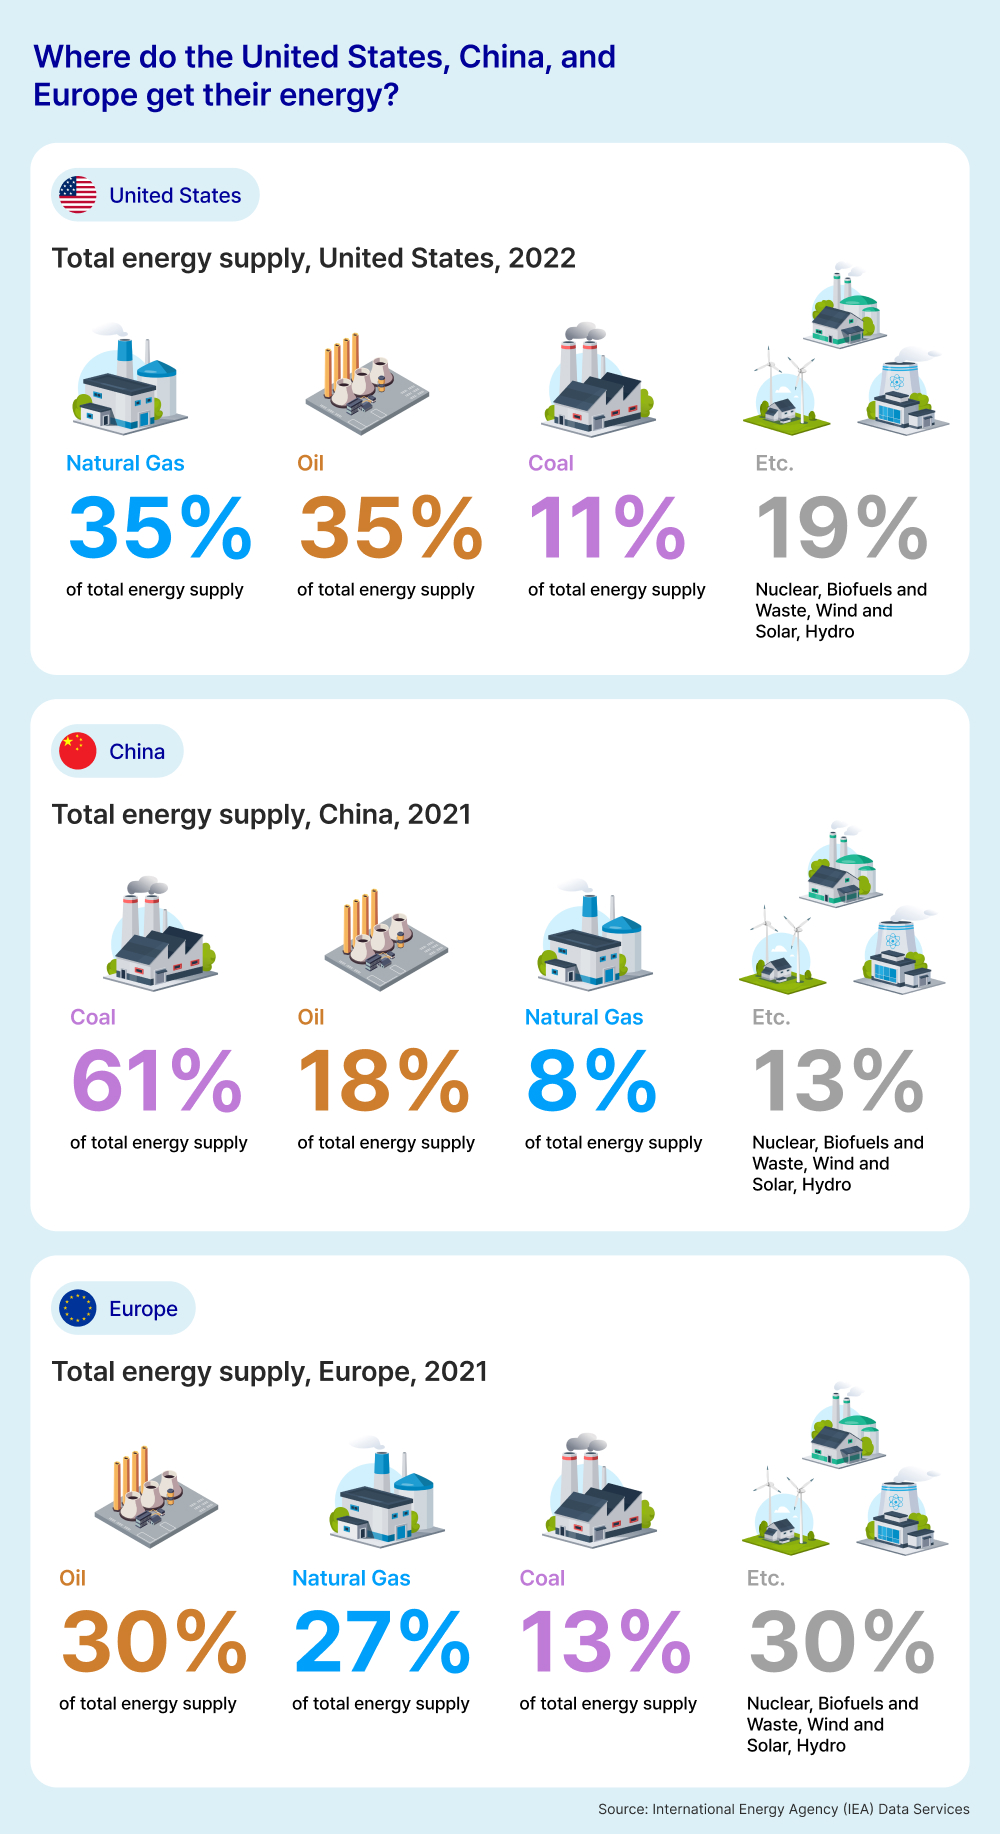
The following image shows the total energy supply in the United States in 2022 and in China and Europe in 2021. The data is sourced from the International Energy Agency (IEA), which analyzes global energy trends. This image gives us an overview of three major markets around the world and the energy they are sourcing.
The Transition to Renewable Energy
In major markets like the U.S., Europe, and China, there has been a large uptick in renewable energy capacity, particularly with wind and solar capacity. It is predicted that 45 to 50 per cent of the world’s generated energy sources will come from renewable energy by 2030.
Building the infrastructure required for transitioning to renewable energy is crucial for the global energy transition. Along with infrastructure, ensuring that legislation and policy are in place to support the usage of renewable energy is another factor that will help countries transition to cleaner energy sources.
Energy Market Insights in the United States
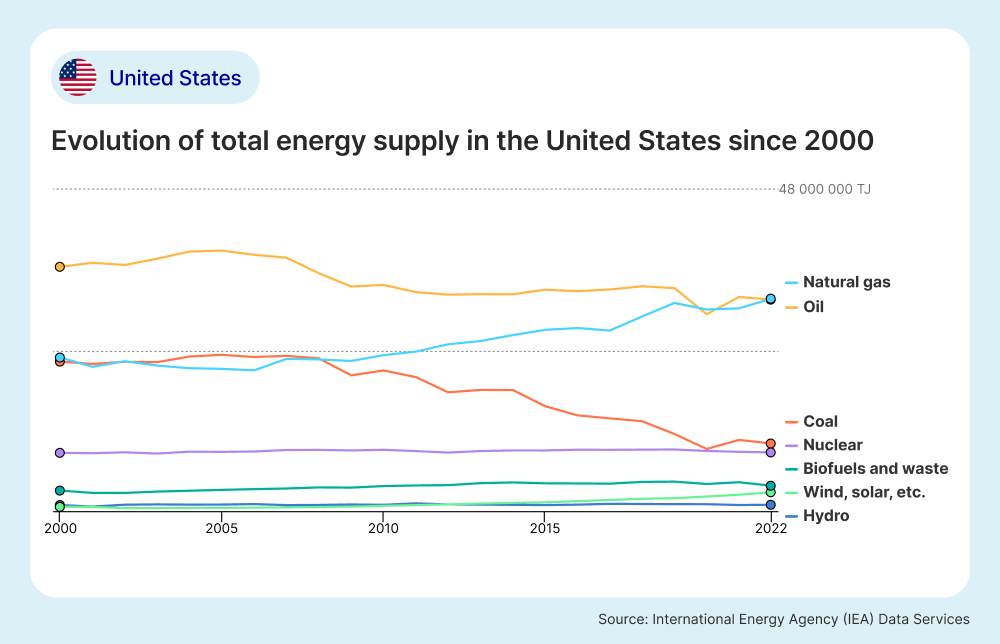
The U.S. is a world leader in oil production and natural gas exports and are seeing significant progress being made in the renewable energy sector. According to data from the IEA, in 2022, oil and natural gas made up the largest amount of total energy supply at 35.2% and 35.4% respectively. The transport sector consumed the most amount of energy sources at 39% while industry (18%) and residential sectors (17.3%) also consumed large amount of the United States’ total energy consumption. Based on the graph below from the IEA, there is a clear trend showing that the U.S. are moving away from coal and relying on other energy sources.
The Transition to Renewable Energy Sources in the United States
In 2022, renewable energy made up 22% of the total amount of power generated in the United States according to the IEA. While 38.7% of the total electricity generated came from natural gas, Wind, hydro, and solar power accounted for 9.8%, 6.4%, and 4.1% of electricity generation respectively.
In 2023, there was a 55% increase in solar energy capacity from the previous year according to the Solar Energy Industries Association, a solar non-profit based in the U.S. While this is promising, the World Resources Institute indicated that the U.S. needs to nearly double its installation rates of renewable energy sources from 2023 in the coming years to achieve its greenhouse gas reduction targets.
It is important to remember that weather conditions and temperatures can cause uncertainty for renewable energy generation due to varying outputs from wind and solar power. Droughts and high precipitation rates can also lead to varying outputs from hydroelectric power. With major investments being made in solar and wind capacity, the U.S. expect to reduce energy generated from coal plants and natural gas plants in 2024.
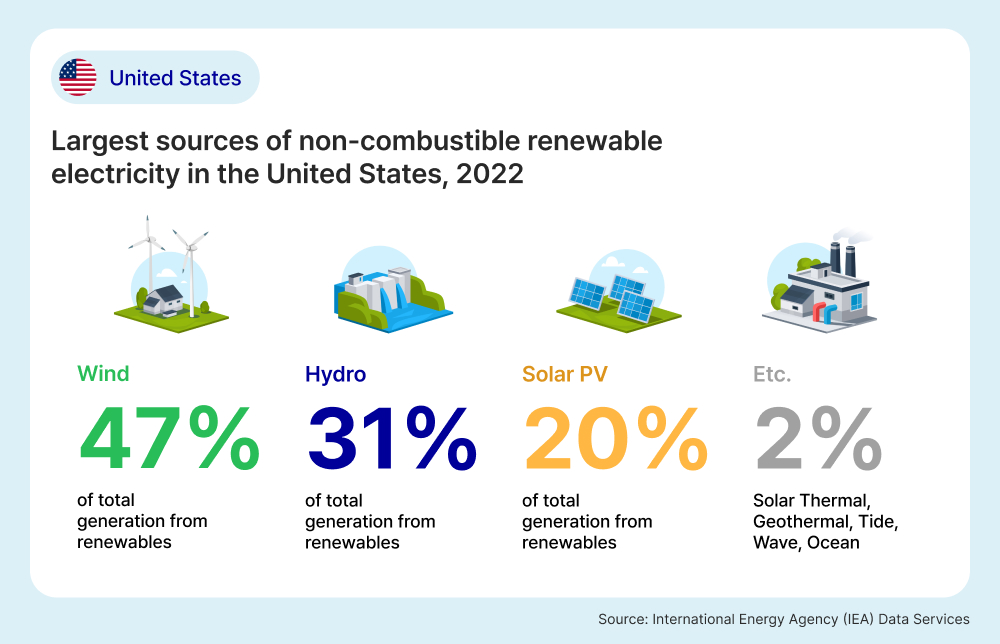
The following image highlights the breakdown of renewable energy sources in the United States in 2022 based on data from the IEA. Wind power (47.1%) was the leading source of renewable energy in 2022, followed by hydro power (30.6%) and Solar photovoltaic power (19.8%) of total generation from renewable sources.
Energy Market Insights in China
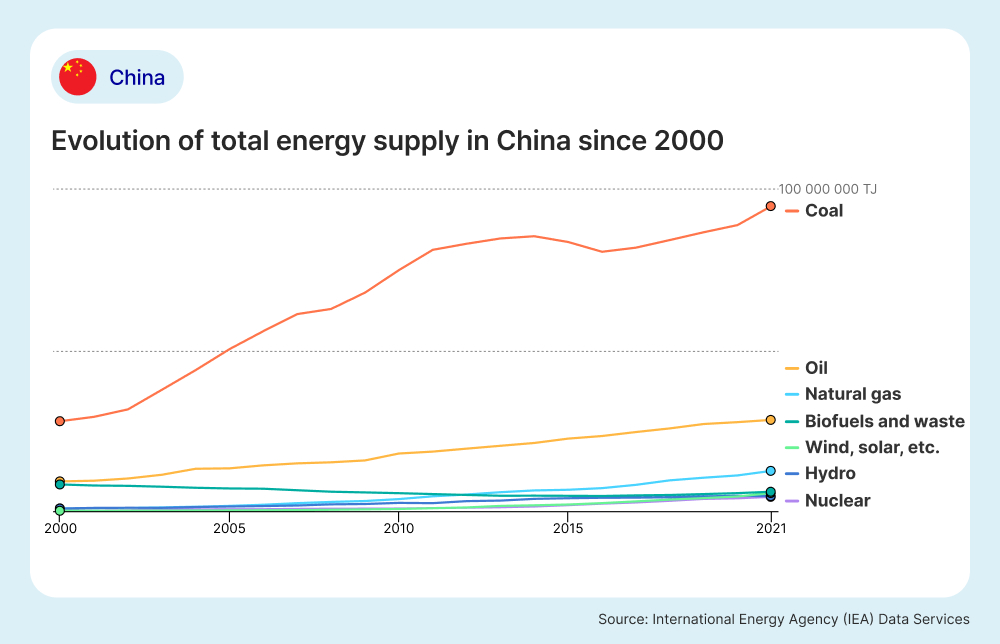
According to data from the IEA, coal made up 71% of China’s total energy supply in 2021. This is a trend that has been increasing significantly over the past 20 years as shown in the graph outlining China’s total energy supply since 2000 below. According to S&P Global, a global data analytics firm, 60% of China’s electricity supply came from coal in 2023. While this is lower than the total in 2021, China’s dependency on coal is still significantly higher than other energy markets such as the U.S. and Europe.
Based on the same data from the IEA, China reported the largest volume of imported energy sources globally in 2021, including fossil fuels like oil and natural gas, making a total of 21.7% of its total energy supply being imported. In 2021, China produced 30, 112, 289 terajoules of refined oil for oil products, a 260% increase since 2000, and the second-largest volume worldwide after the United States.
The following image shows the trends in China’s total energy supply between 2000 to 2021 based on data from the IEA. While coal dependency has increased over the past 20 years, renewables such as wind, solar and hydro power have also increased, but at a significantly lower rate.
China’s Transition to Renewable Energy Sources
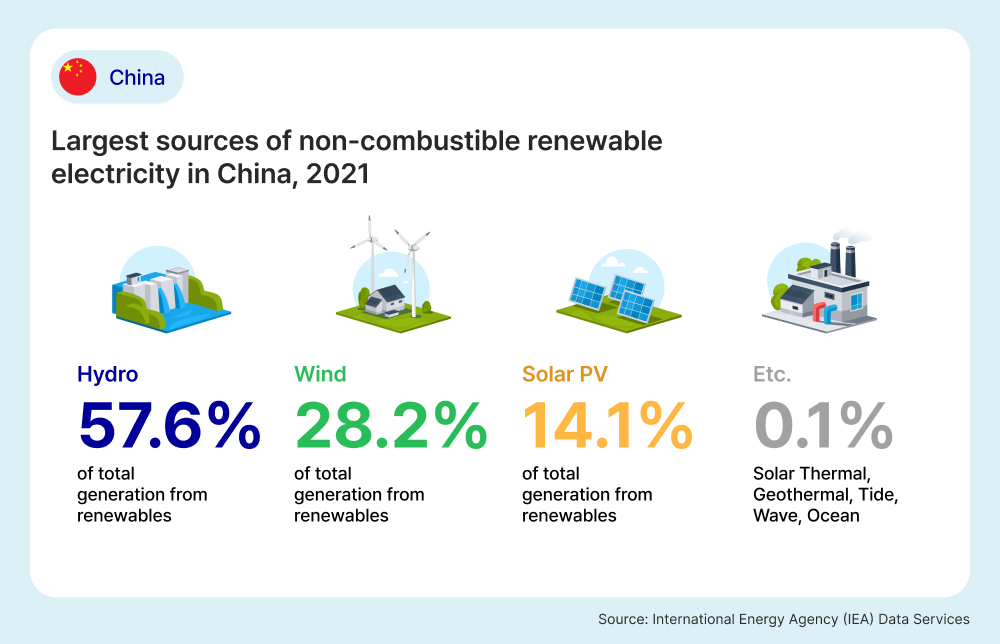
According to Reuters, China is the world’s largest coal user and the biggest producer of renewable energy, and in 2020, aimed to achieve carbon neutrality by 2060. In 2021, 23.4% of China’s power generation came from renewable energy sources, according to the IEA. The leading source of renewable energy generation was hydroelectric energy, making up 57.6% of total renewable energy generation. This was followed by wind energy at 28.2% and solar photovoltaic at 14.1%, as outlined in the image below.
According to a report from S&P Global about China’s energy supply in 2023, China installed roughly as much solar capacity as the rest of the world combined in 2022, then doubled additional solar in 2023. The nation also increased new wind capacity by 66 percent, and almost quadrupled additions of energy storage. However, as previously mentioned, China still depends heavily on fossil fuels, and renewable energy usage lags behind installed capacity. In 2023, the average utilization hours of its solar PV plants were down 54 hours year on year, according to insights from S&P Global.
The image below breaks down China’s renewable energy sources as a percentage of its total renewable energy generation in 2021 based on data from the IEA.
Energy Market Insights in Europe
Europe has been a leader in the global energy transition, with many countries setting ambitious targets for reducing carbon emissions and increasing renewable energy capacity. The European Union’s Green Deal aims to make Europe the first climate-neutral continent by 2050, according to the European Commission.
Energy security has become a big priority for European nations since Russia’s invasion of Ukraine. The war resulted in significant price increases of resources such as fuel, leading to a subsequent energy crisis. This has also spurred Europe’s ambitions for increasing its renewable energy resources.
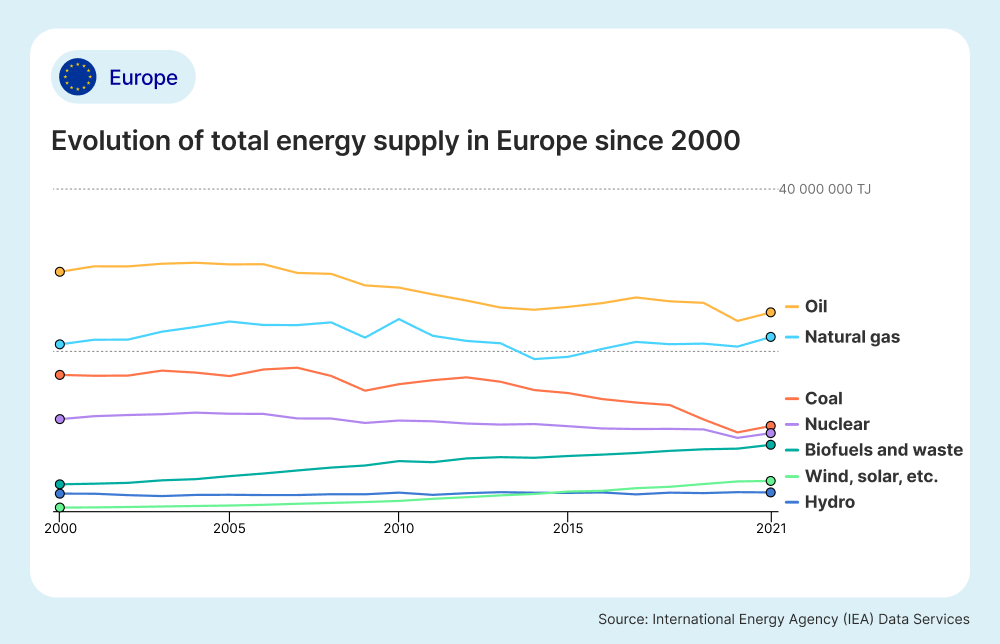
According to the IEA, Europe generated 21% of its total electricity from natural gas, 21% from nuclear energy, and 16% from hydropower in 2021. Europe also relies on imports from other countries which made up around 56% of its energy sources in 2021 according to the European Commission. In 2021, renewable energy sources accounted for more than 22% of the EU’s total energy consumption, with wind and solar power playing significant roles.
The graph below, based on data from the IEA, outlines the trends in Europe’s total energy supply from 2000 to 2021. It shows a steady decrease in coal supply and increases in renewables like wind and solar over time.
Based on the same data from the IEA, China reported the largest volume of imported energy sources globally in 2021, including fossil fuels like oil and natural gas, making a total of 21.7% of its total energy supply being imported. In 2021, China produced 30, 112, 289 terajoules of refined oil for oil products, a 260% increase since 2000, and the second-largest volume worldwide after the United States.
The following image shows the trends in China’s total energy supply between 2000 to 2021 based on data from the IEA. While coal dependency has increased over the past 20 years, renewables such as wind, solar and hydro power have also increased, but at a significantly lower rate.
Europe's Transition to Renewable Energy Sources
In 2023, Europe experienced a 19% decrease in fossil fuels in its total energy sources and a reduction of -157 tons of carbon dioxide emitted from the power sector in total, according to a European Electricity Review by Ember, a non-profit energy think tank based in the European Union. According to the same report, renewable energy surged to 44% of Europe’s total energy supply in 2023, with solar and wind power making up the largest proportion.
Europe has been investing heavily in renewable energy infrastructure, with significant funding allocated to wind, solar, and hydrogen projects. Countries like Germany, Denmark, and Spain have been at the forefront of these efforts.
Europe’s renewable energy directive sets binding targets for member states to achieve a collective share of at least 32% renewable energy in the Europe’s total energy consumption by 2030. In countries including Germany, Italy, Spain, and Poland, closures of coal plants are planned across 2024 and 2025 which further highlights Europe’s commitment to the energy transition to renewables.
The image below breaks down Europe’s renewable energy sources as a percentage of its total renewable energy generation in 2021 based on data from the IEA.
According to a report from S&P Global about China’s energy supply in 2023, China installed roughly as much solar capacity as the rest of the world combined in 2022, then doubled additional solar in 2023. The nation also increased new wind capacity by 66 percent, and almost quadrupled additions of energy storage. However, as previously mentioned, China still depends heavily on fossil fuels, and renewable energy usage lags behind installed capacity. In 2023, the average utilization hours of its solar PV plants were down 54 hours year on year, according to insights from S&P Global.
The image below breaks down China’s renewable energy sources as a percentage of its total renewable energy generation in 2021 based on data from the IEA.

The global energy transition is a complex but necessary process to address the urgent threat of climate change. While significant progress has been made in major markets like the United States, China, and Europe, much work remains to be done. Continued investment in renewable energy infrastructure, supportive policies, and the adoption of low-carbon technologies will be crucial in achieving our global climate goals.
Samsung C&T’s Role in the Energy Transition
Samsung C&T Trading & Investment Group has gained experience and know-how in energy resource trading, renewable energy development, and operations businesses. The Group is working to develop various businesses that align with the goals of the global energy transition. The Samsung C&T Trading and Investment Group aims to contribute to the global energy transition by continuously strengthening its green business portfolio across the whole value chain, focusing on solar power development projects, rechargeable battery materials, clean hydrogen, etc.
The data and information in this article was gathered from various sources, including the International Energy Agency (IEA), the European Commission, the World Resources Institute, and McKinsey and Company.