Overall Performance
Revenue: KRW 10.971T, Operating Profit: KRW 830B
- Year-over-Year (YoY) comparison:
- Quarter-over-Quarter (QoQ) comparison:
Revenue increased by KRW 385B (3.6%) from KRW 10.586T in Q2 2023
Operating profit increased by KRW 58B (7.5%) from KRW 772B in Q2 2023
In the face of prolonged global economic uncertainty, Q3 saw Samsung C&T post growth YoY and QoQ as the company maintained profitability on the back of the differentiated competitiveness of its businesses.
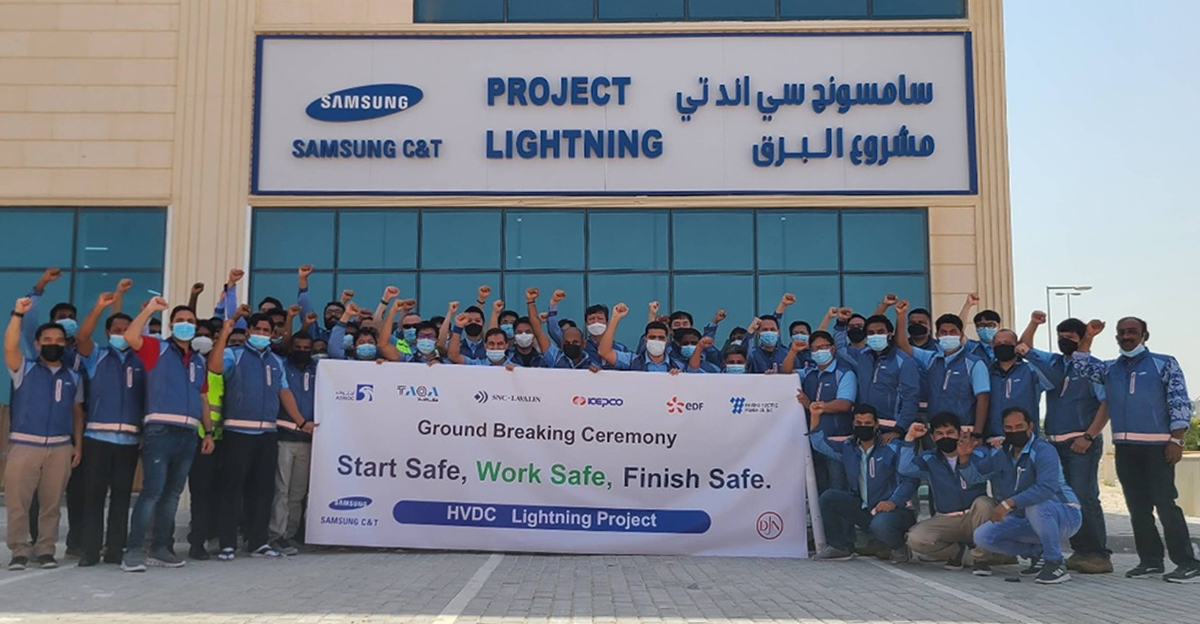
The Engineering & Construction Group performed strongly with high-quality overseas projects beginning to generate revenue in earnest. The Trading & Investment Group saw a YoY increase in operating profit as it continued to enjoy strengthened trading competitiveness and enhanced efficiency in its operating businesses.
The Fashion Group recorded a slight drop in revenue due to it being the off-season combined with a decline in consumer confidence, but saw a rise in operating profit. The Resort Group’s revenue and operating profit both grew on the back of increased leisure demand and new F&B business sites.
While external and internal circumstances are expected to deteriorate, Samsung C&T will strive to maintain a higher level of profitability in Q4.
With cumulative new orders in Q3 reaching KRW 15.6T, the company will seek to meet its annual target of KRW 19.9T as new domestic and overseas orders are set to continue.
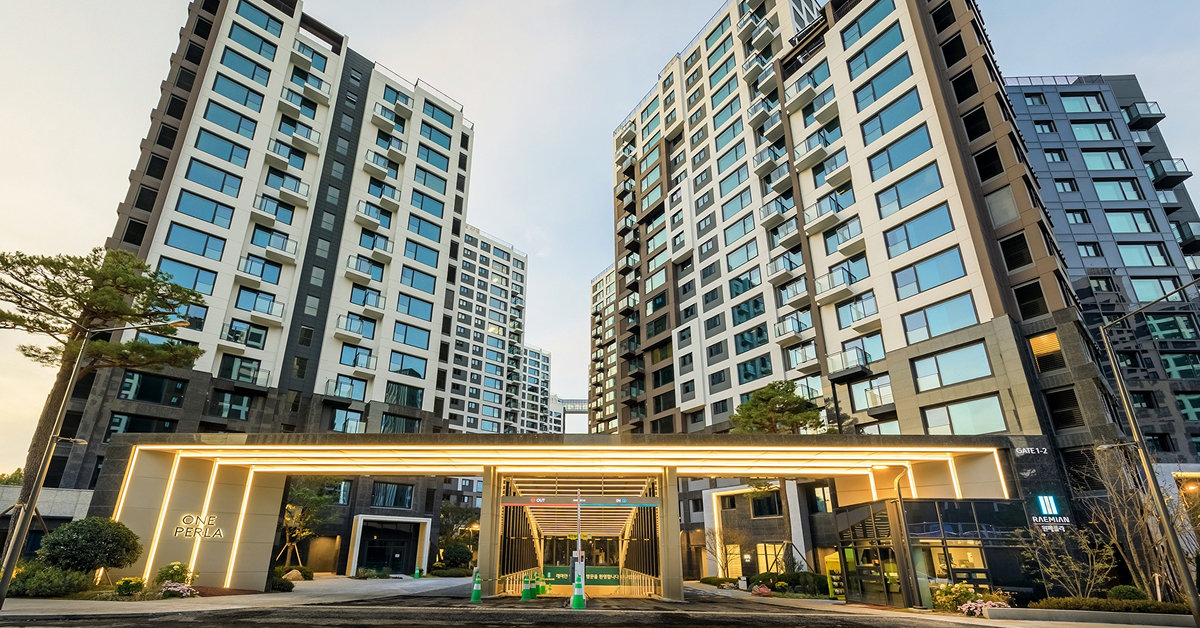
Engineering & Construction Group
Revenue: KRW 5.282T, Operating Profit: KRW 303B
– YoY comparison:
Revenue rose by KRW 1.093T (26.1%) from KRW 4.189T in Q3 2022,
operating profit fell by KRW 21B (-6.5%) from KRW 324B in Q3 2022
– QoQ comparison:
Revenue rose by KRW 531B (11.2%) from KRW 4.751T in Q2 2023,
operating profit fell by KRW 2B (-0.7%) from KRW 305B in Q2 2023
Trading & Investment Group
– YoY comparison:
Revenue fell by KRW 1.542T (-32.2%) from KRW 4.796T in Q3 2022,
operating profit rose by KRW 30B (50.9%) from KRW 59B in Q3 2022
– QoQ comparison:
Revenue fell by KRW 262B (-7.5%) from KRW 3.516T in Q2 2023,
operating profit fell by KRW 25B (-21.9%) from KRW 114B in Q2 2023
Fashion Group
– YoY comparison:
Revenue fell by KRW 15B (-3.2%) from KRW 471B in Q3 2022,
operating profit rose by KRW 4B (13.8%) from KRW 29B in Q3 2022
– QoQ comparison:
Revenue fell by KRW 68B (-13.0%) from KRW 524B in Q2 2023,
operating profit fell by KRW 24B (-42.1%) from KRW 57B in Q2 2023
Resort Group
– YoY comparison:
Revenue rose by KRW 15B (1.6%) from KRW 930B in Q3 2022,
operating profit rose by KRW 21B (29.2%) from KRW 72B in Q3 2022
– QoQ comparison:
Revenue rose by KRW 16B (1.7%) from KRW 929B in Q2 2023,
operating profit rose by KRW 44B (89.8%) from KRW 49B in Q2 2023